22.14. TCPDump
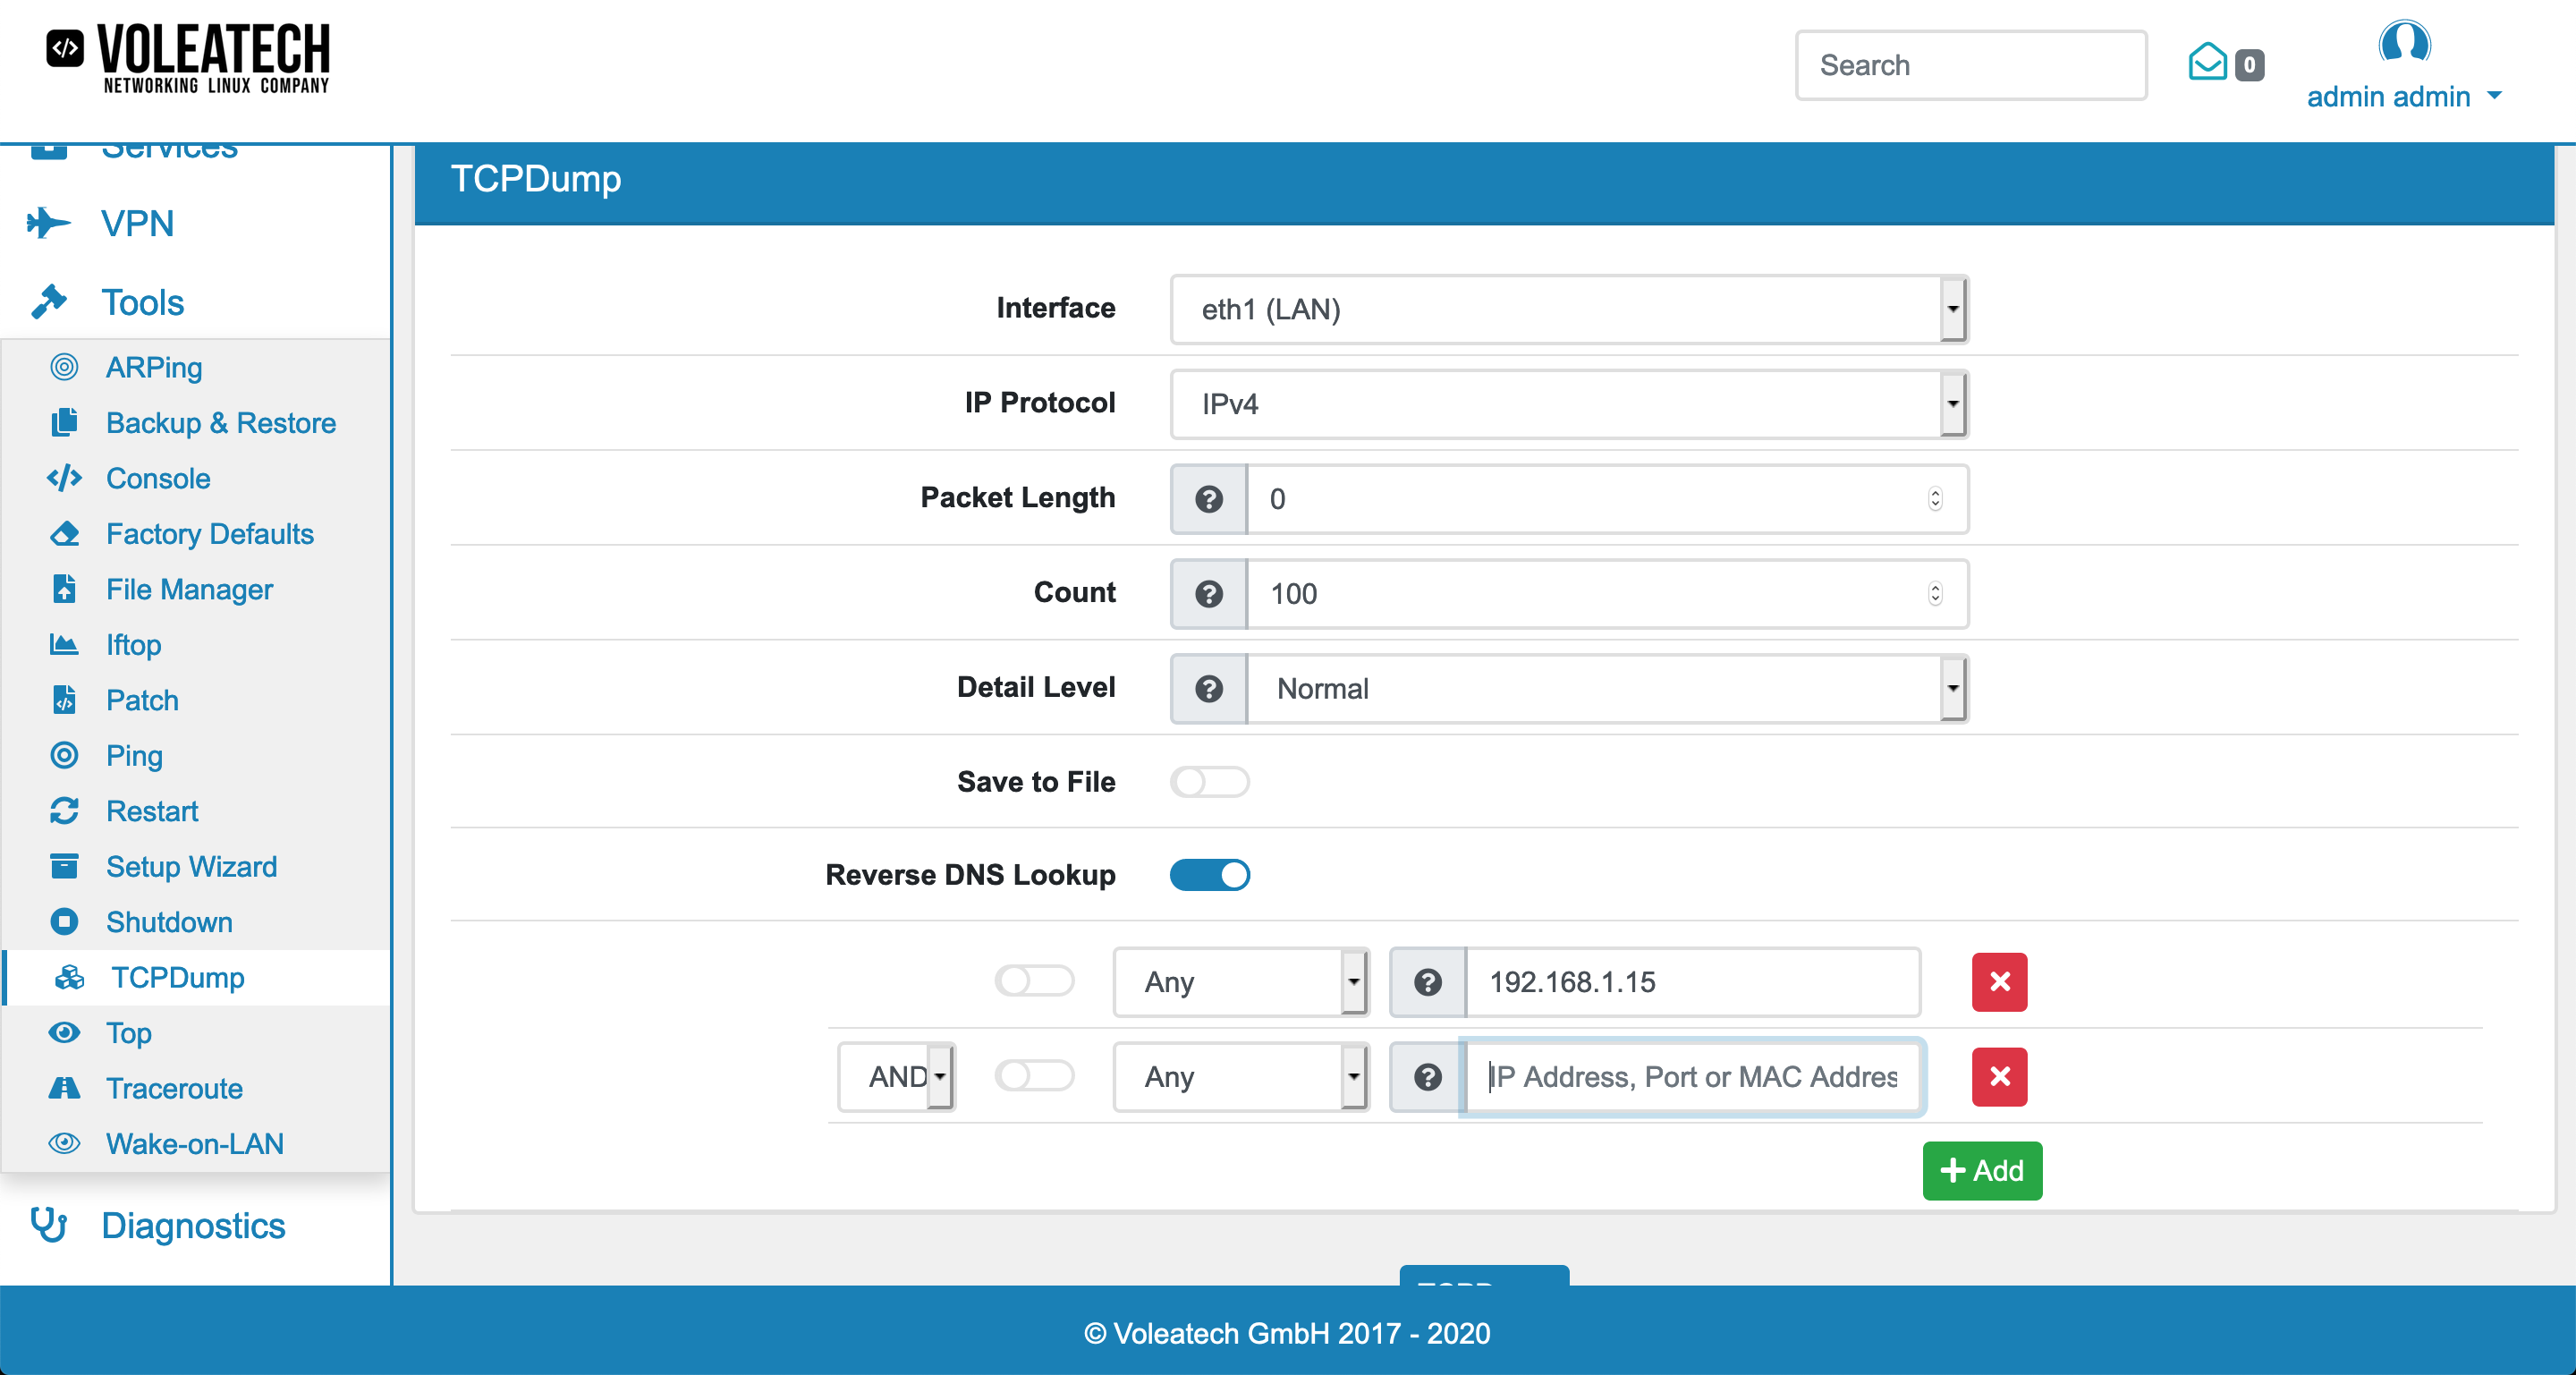
You can find the TCPDump Tool at Tools → TCPDump.
This tool is a packet analyzer that displays TCP/IP and other packets which are transmitted and received over the network.
The information is shown in real time in your browser.
You can specify the interface and the IP Protocol, v4 or v6. The count determines, after how many packets it stops. With packet length you can specify the number of bytes it will capture for each package. The default is 0 which will capture everything. A detail level can also be configured, which is set to normal by default.
If you don’t use the IPSec interface, there is also the possibility to add additional filters by protocol, IP address, port or mac address. Those filters can be connected via logical operators like and, or and not.
You can also download the trace afterwards if you enable the Save to File option before you start tcpump.
The output could look like this:
tcpdump: listening on any, link-type LINUX_SLL (Linux cooked), capture size 262144 bytes
12:51:21.060482 IP (tos 0x0, ttl 64, id 3784, offset 0, flags [DF], proto TCP (6), length 162)
    vtair.localhost.hq.voleatech.com.8000 > IT1.hq.voleatech.com.57318: Flags [P.], cksum 0x92ec (incorrect -> 0xbd6a), seq 2584698705:2584698827, ack 1786006290, win 120, length 122
12:51:21.100800 IP (tos 0x0, ttl 127, id 26583, offset 0, flags [DF], proto TCP (6), length 40)
    IT1.hq.voleatech.com.57318 > vtair.localhost.hq.voleatech.com.8000: Flags [.], cksum 0x66f0 (correct), seq 1, ack 122, win 2052, length 0
12:51:21.365874 IP (tos 0x0, ttl 64, id 46612, offset 0, flags [DF], proto ICMP (1), length 28)
    vtair.localhost.hq.voleatech.com > 192.168.10.1: ICMP echo request, id 0, seq 17114, length 8
12:51:21.365959 IP (tos 0x0, ttl 64, id 0, offset 0, flags [DF], proto ICMP (1), length 28)
    192.168.10.1 > vtair.localhost.hq.voleatech.com: ICMP echo reply, id 0, seq 17114, length 8
12:51:21.384065 ARP, Ethernet (len 6), IPv4 (len 4), Request who-has 192.168.10.143 tell pfSensedev.dev.hq.voleatech.com, length 46
12:51:21.396593 IP (tos 0x0, ttl 64, id 14672, offset 0, flags [DF], proto TCP (6), length 91)
With TCPDump you can analyze the communication on your network in great detail. If you’re only interested in the communication of a specific host you can specify its IP address in the filter section. This way you’re given all the packets that are sent and received by this host.
If you’re only interested in the traffic of a specific host relating to a specific port/protocol you can also specify the port number in the filtering section. This way you can customize your TCPDump request and get a much cleaner result that is a lot easier to interpret.
22.14.1. Troubleshooting via TCPDump
You can also access the TCPDump feature via the Console. To do this, log in to your VT AIR device via SSH or via a serial connection (see Console Access for more details). Once you are logged in, type shell to access the Shell.
Type the command
nohup tcpdump -i INT -w /var/tmp/packetcapture.pcap -W 3 -C 10 -n host IPADDRESS and port PORT &
with INT being the physical interface (for example eth1), IPADDRESS being the IP address of the host you want to observe the connection with and PORT being the port of the connection you want to observe. This creates a maximum of three files with 10MB (rotating). You can analyze the files later on.
Type
pkill tcpdump
to end the process. Afterwards you can look at the results by loading the file into Wireshark or by typing
tcpdump -r /var/tmp/packetcapture.pcap0 -n -vvvv -XX
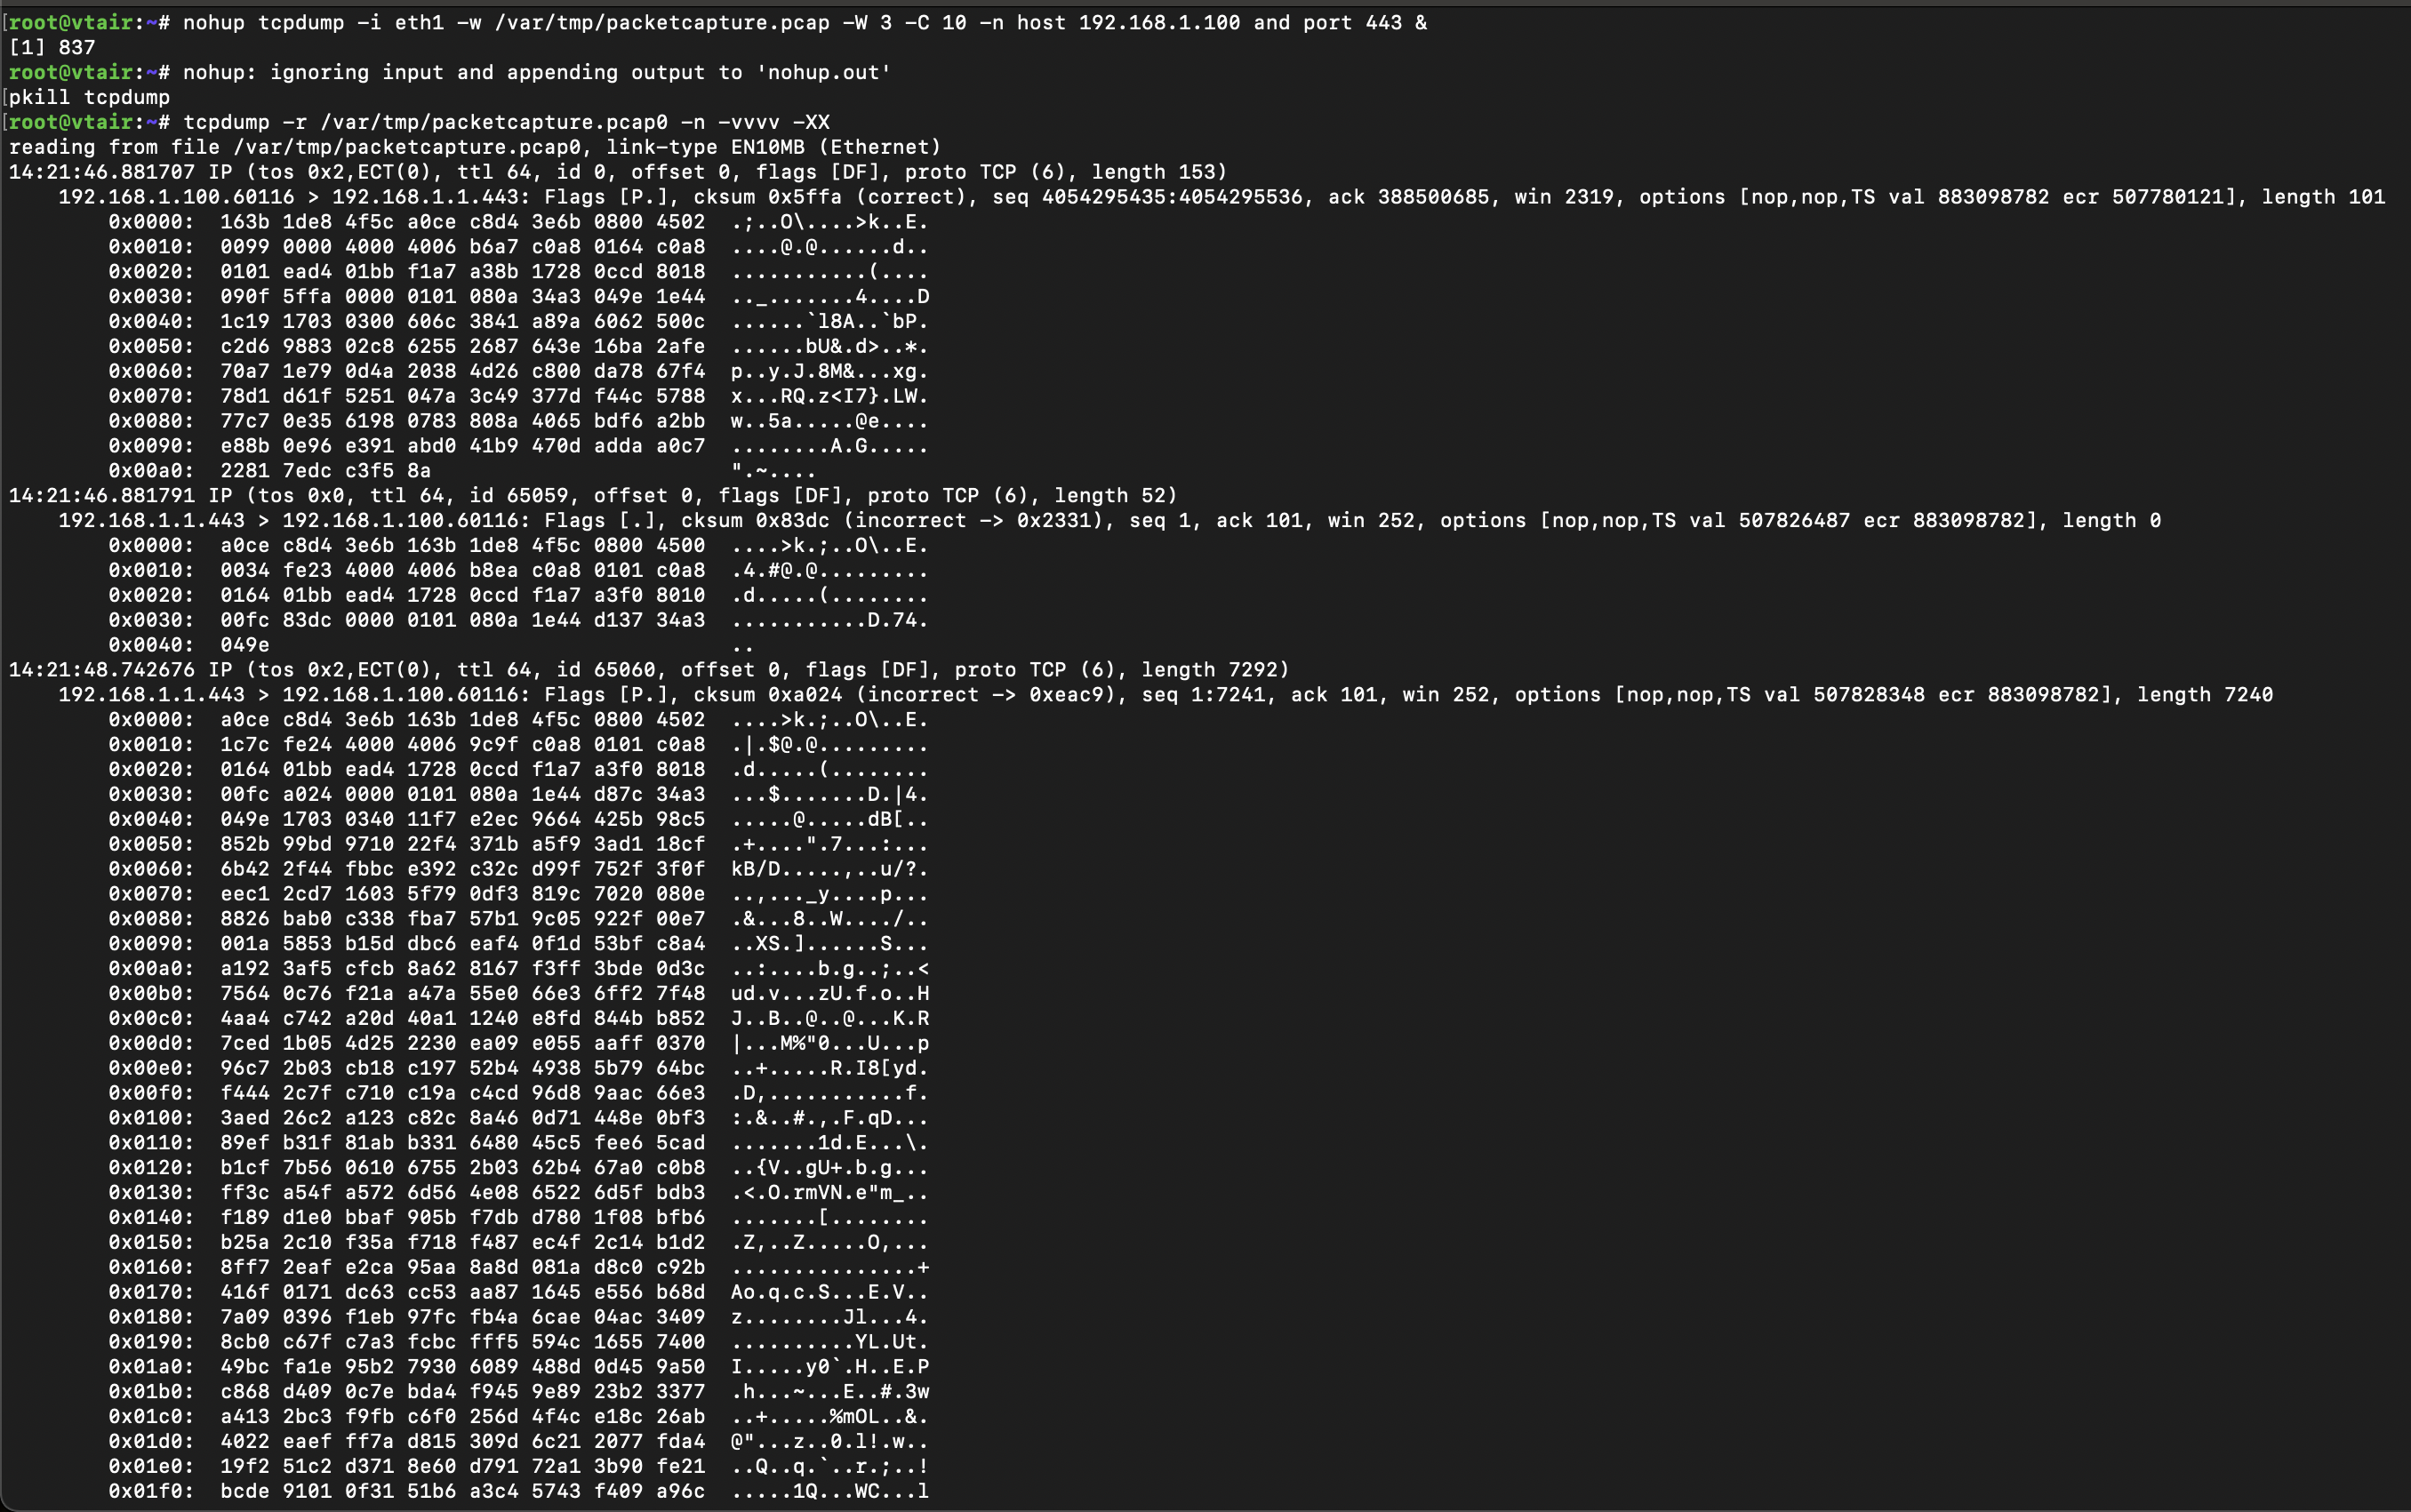
This is very helpful to find sporadic connection or network problems that can not be reproduced right away.