21.42. Sysstat
You can find the Sysstat Diagnostics at Diagnostics → Sysstat.
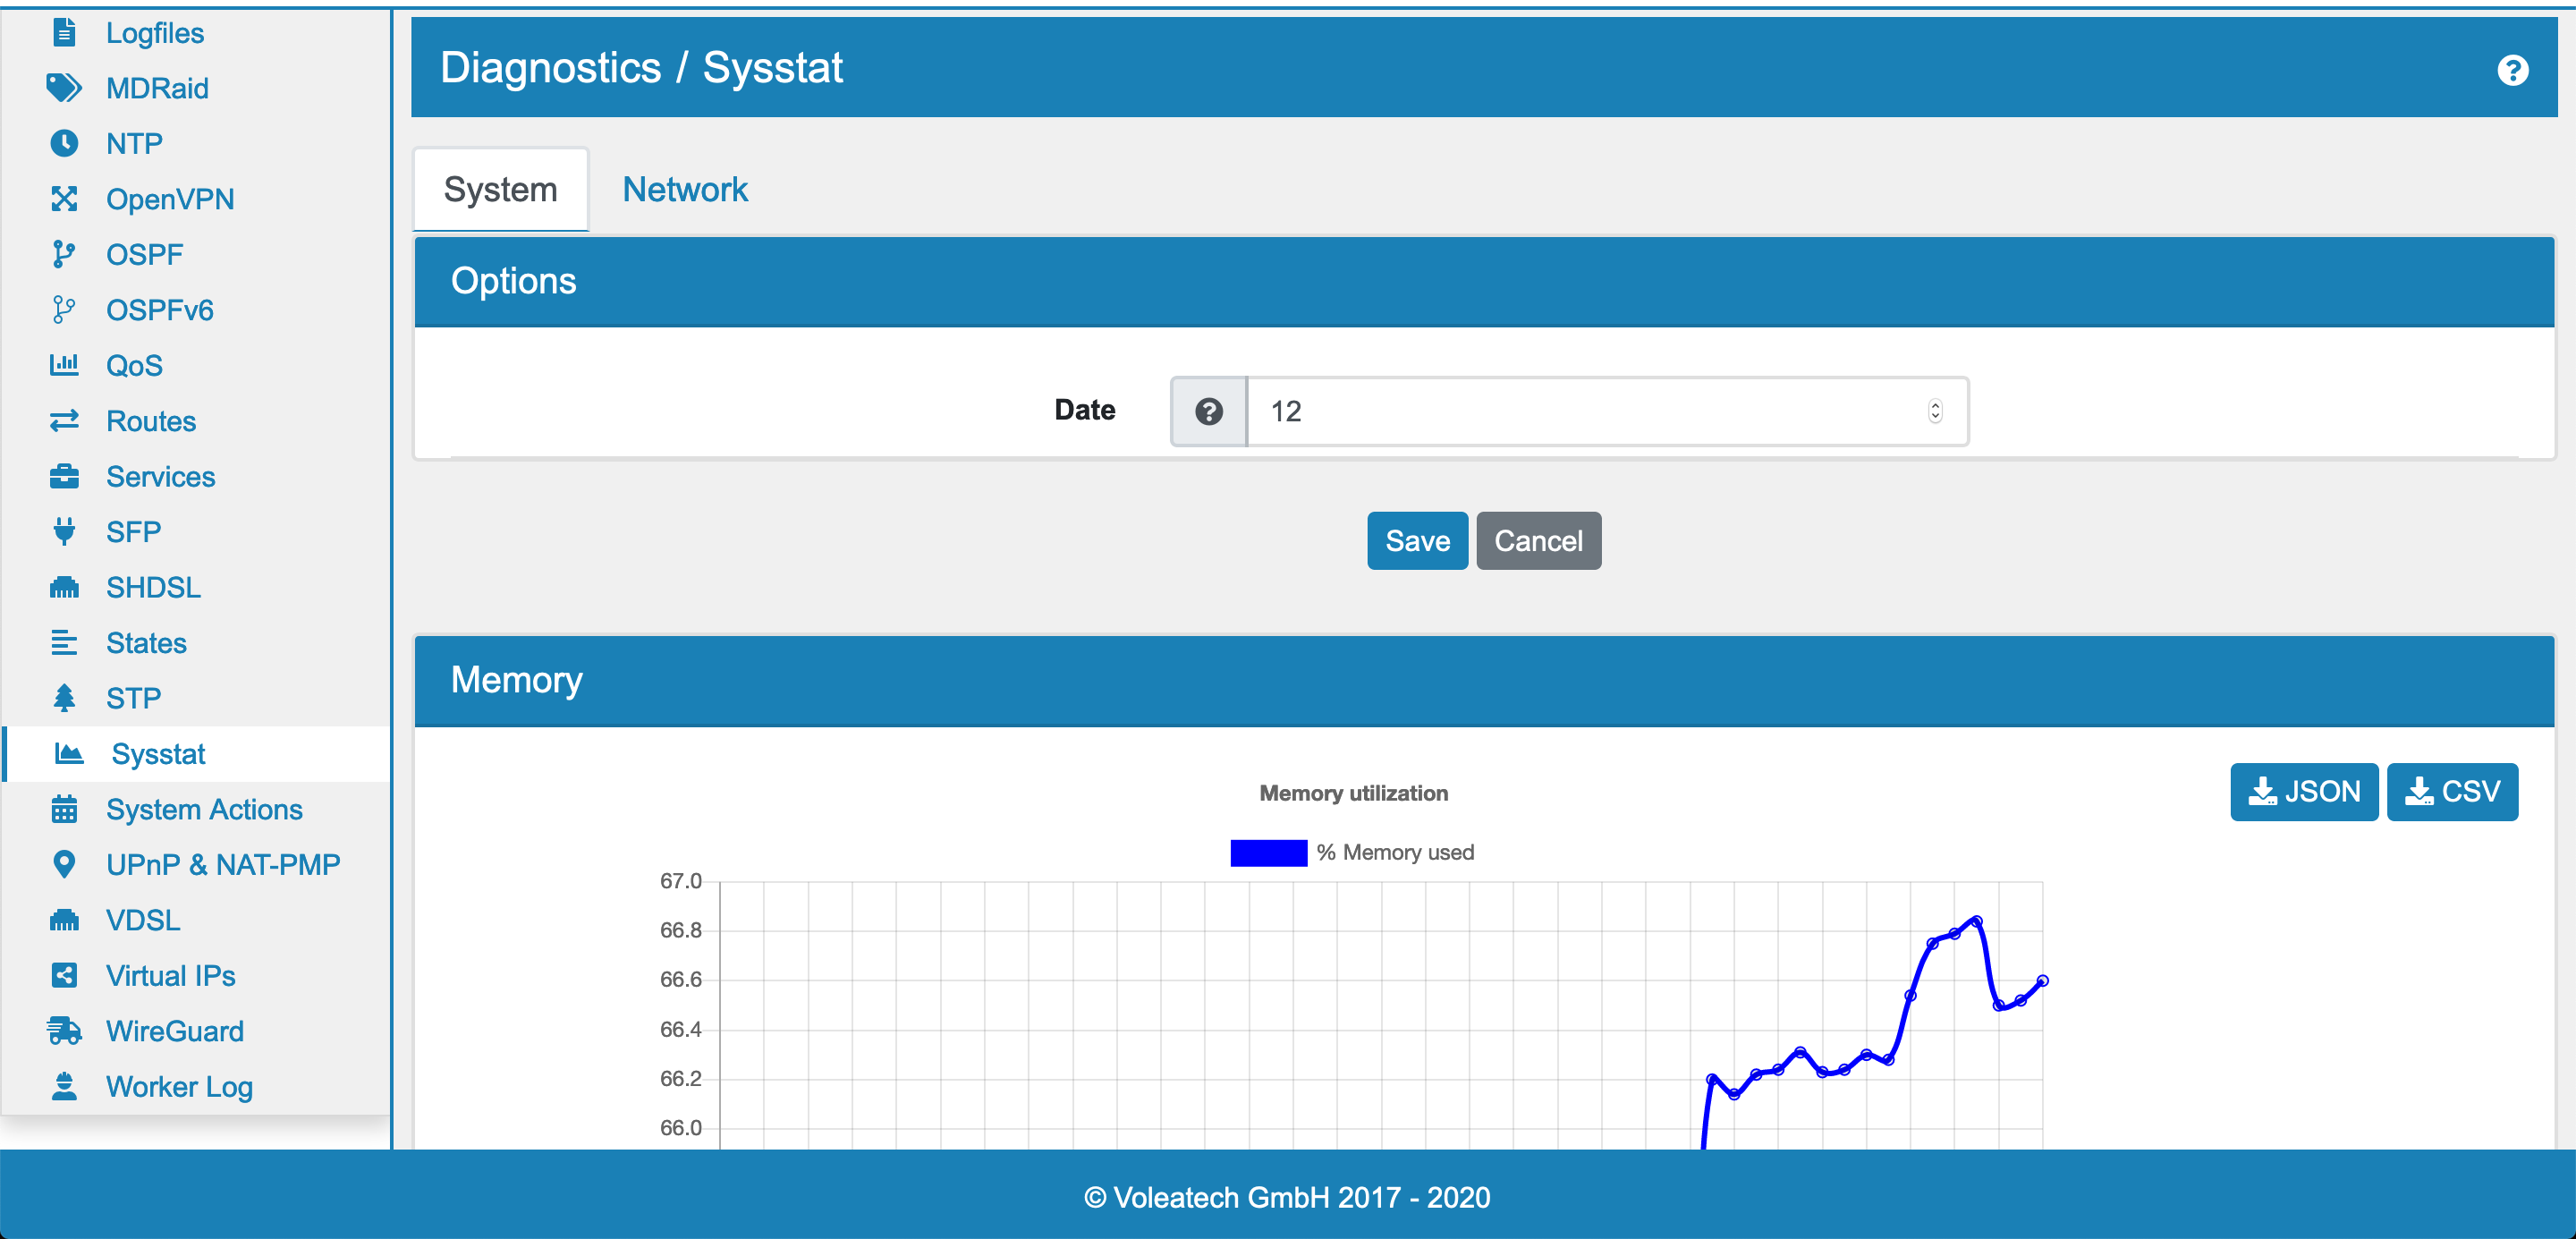
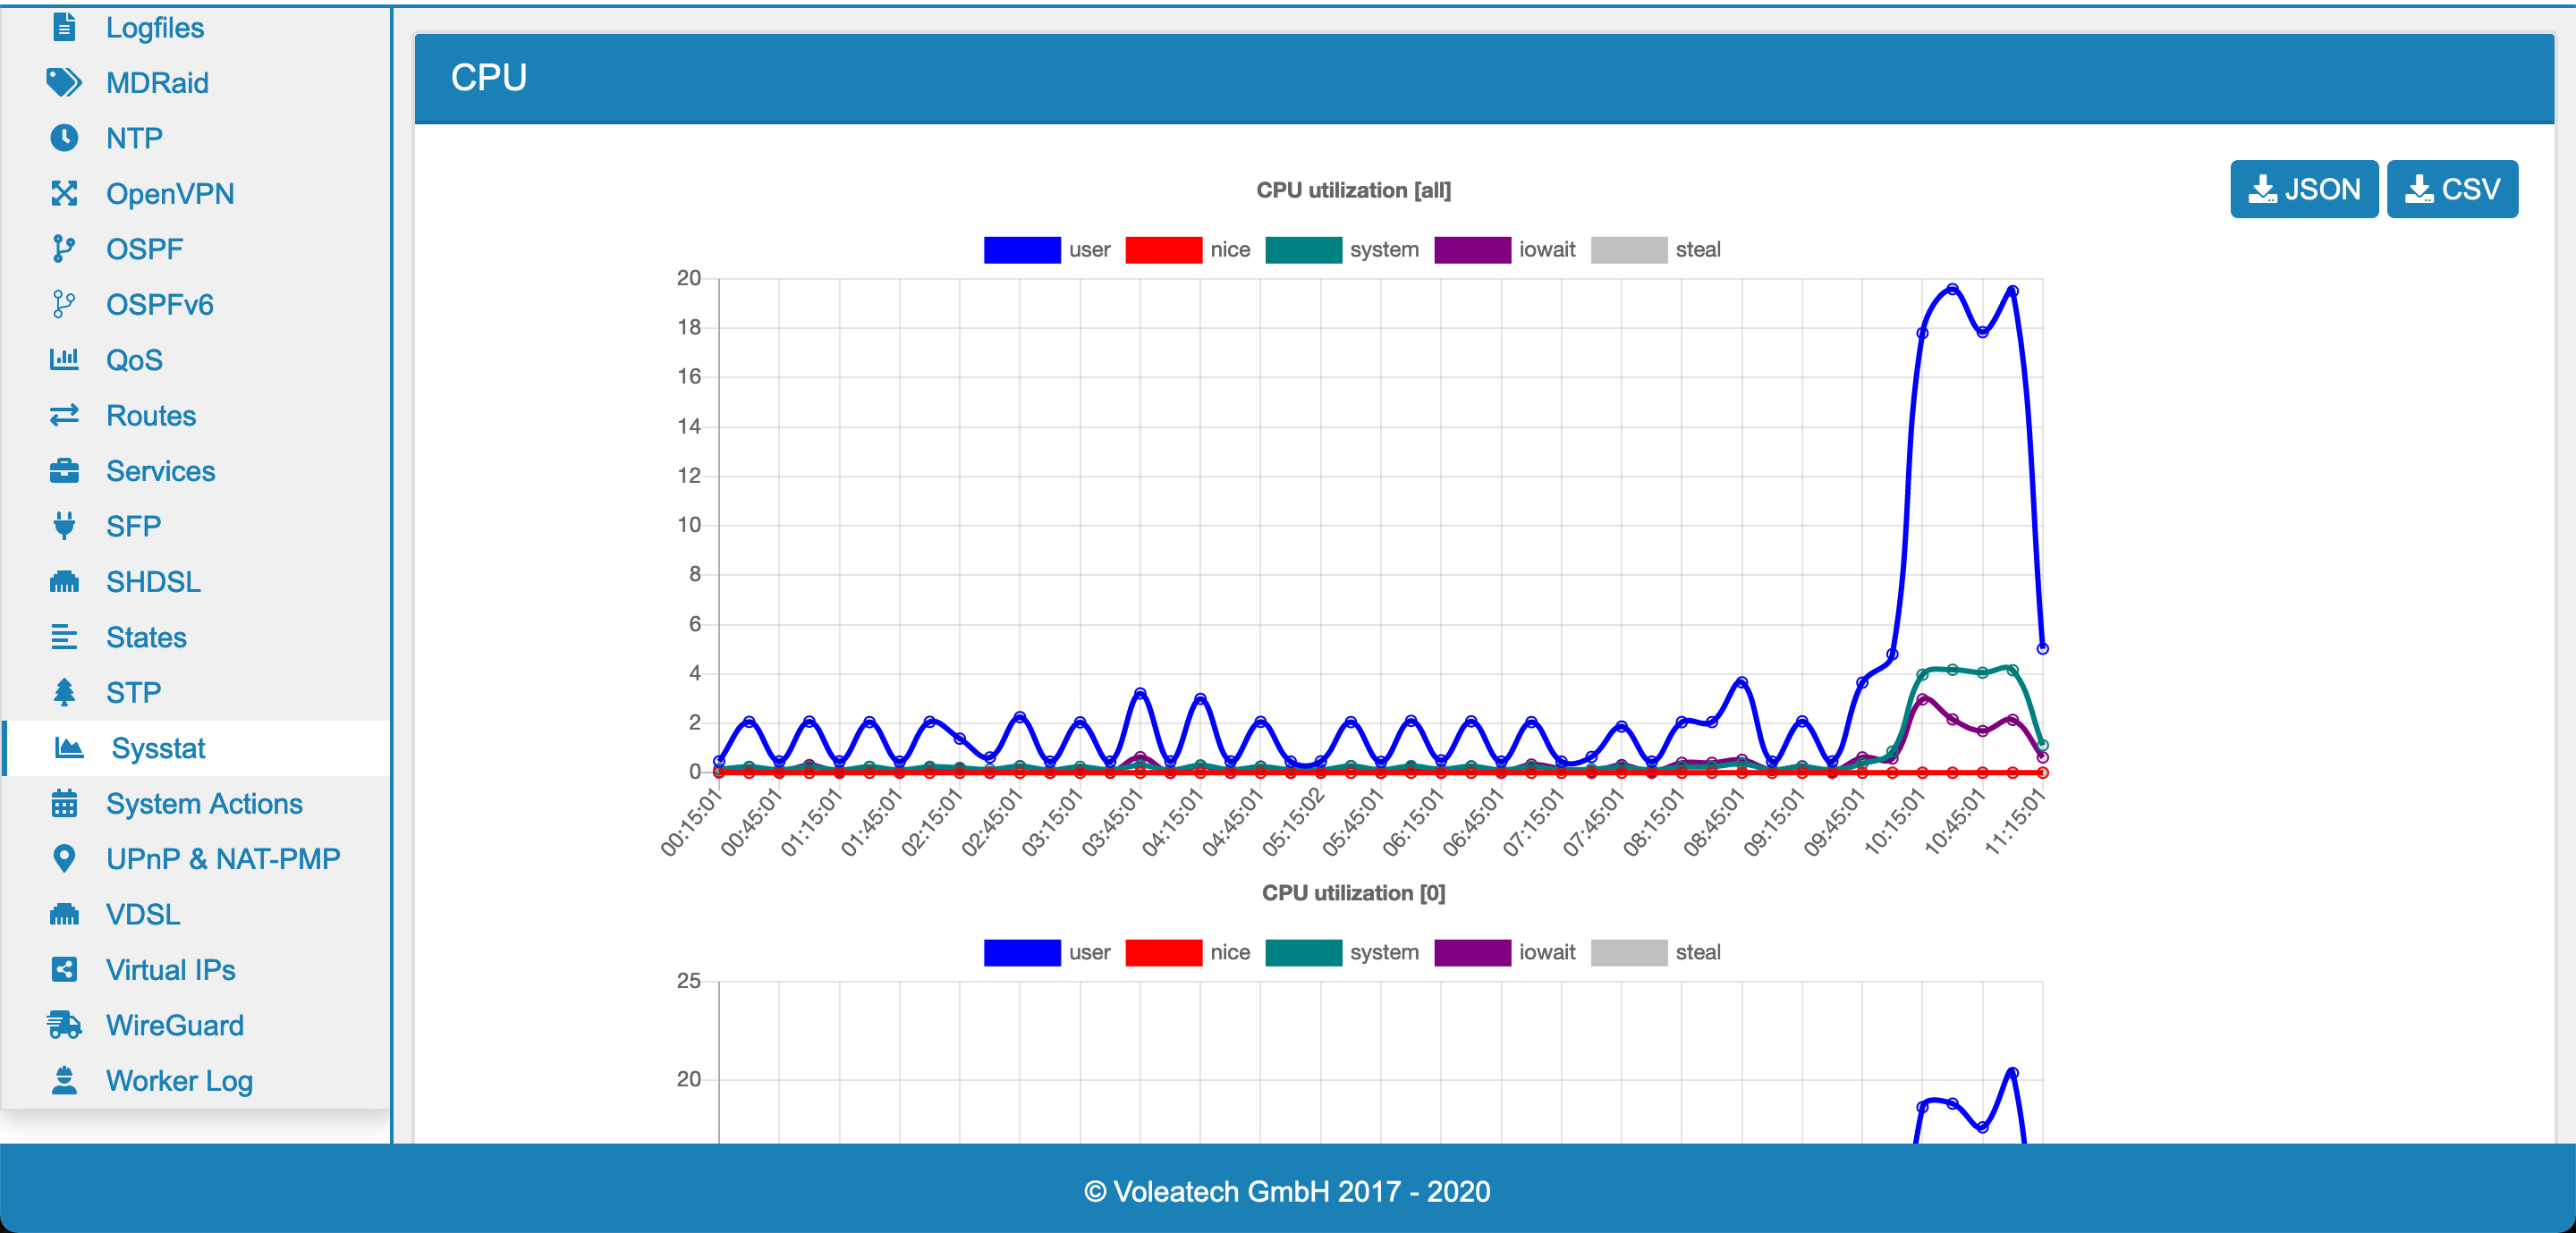
Here you can see information graphics about your CPU, Memory, I/O and Network usage.
The data of each category can be downloaded as JSON or CSV format.
You can choose a date to show for the graphs. The data is kept in a rotation for a month per date. You can always choose between the 1st and the last day of the month and if the current month has not reached a day it is filled with data from the previous month.
On the Network tab you can also choose to show data for all or a single interface.