21.50. Web Application Firewall
You can find the Web Application Firewall Diagnostics at Diagnostics → Services → Web App FW.
The diagnostics provide two tabs.
The Overview tab provides general information like the used rules version.
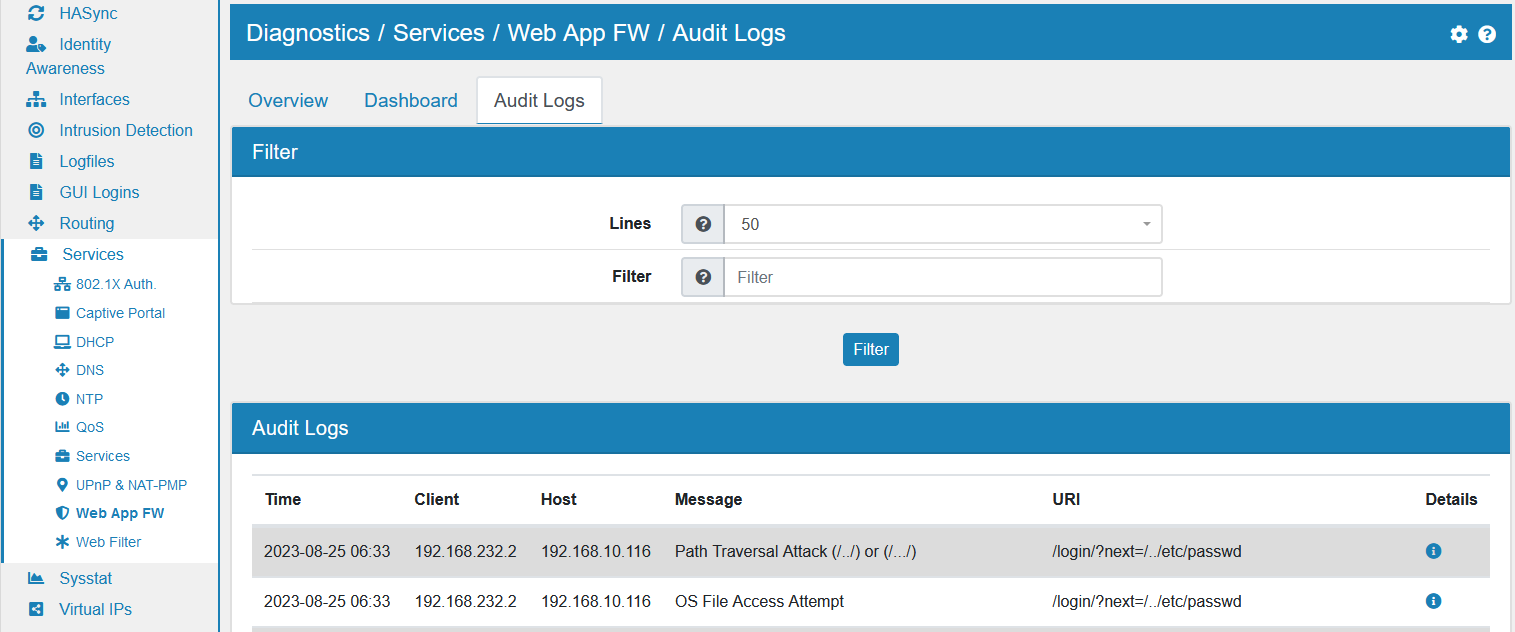
The Audit Log shows detailed information for each triggered rule. Each log entry has Time, Client, Host, Message and URI as well as a details button the right side to show even more pieces of information.
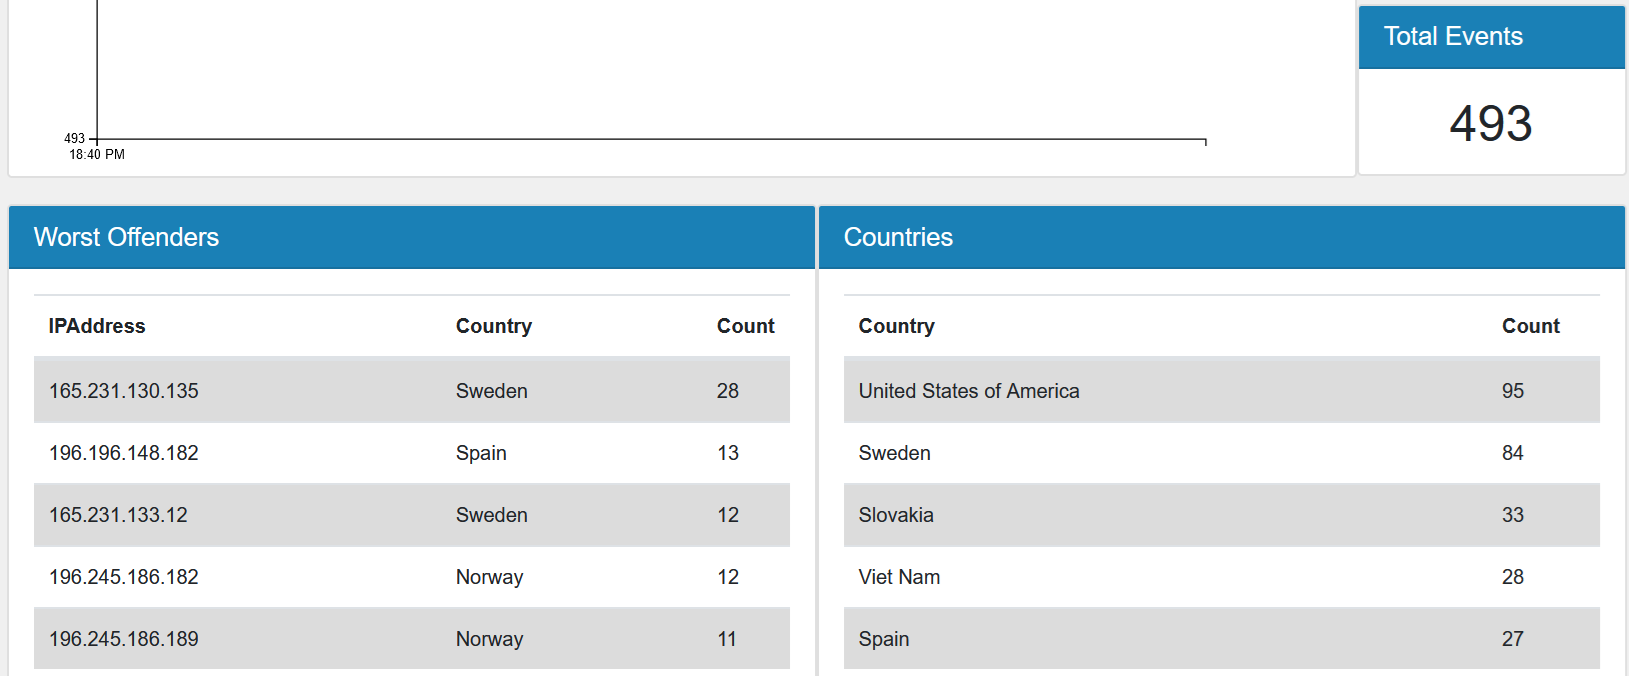
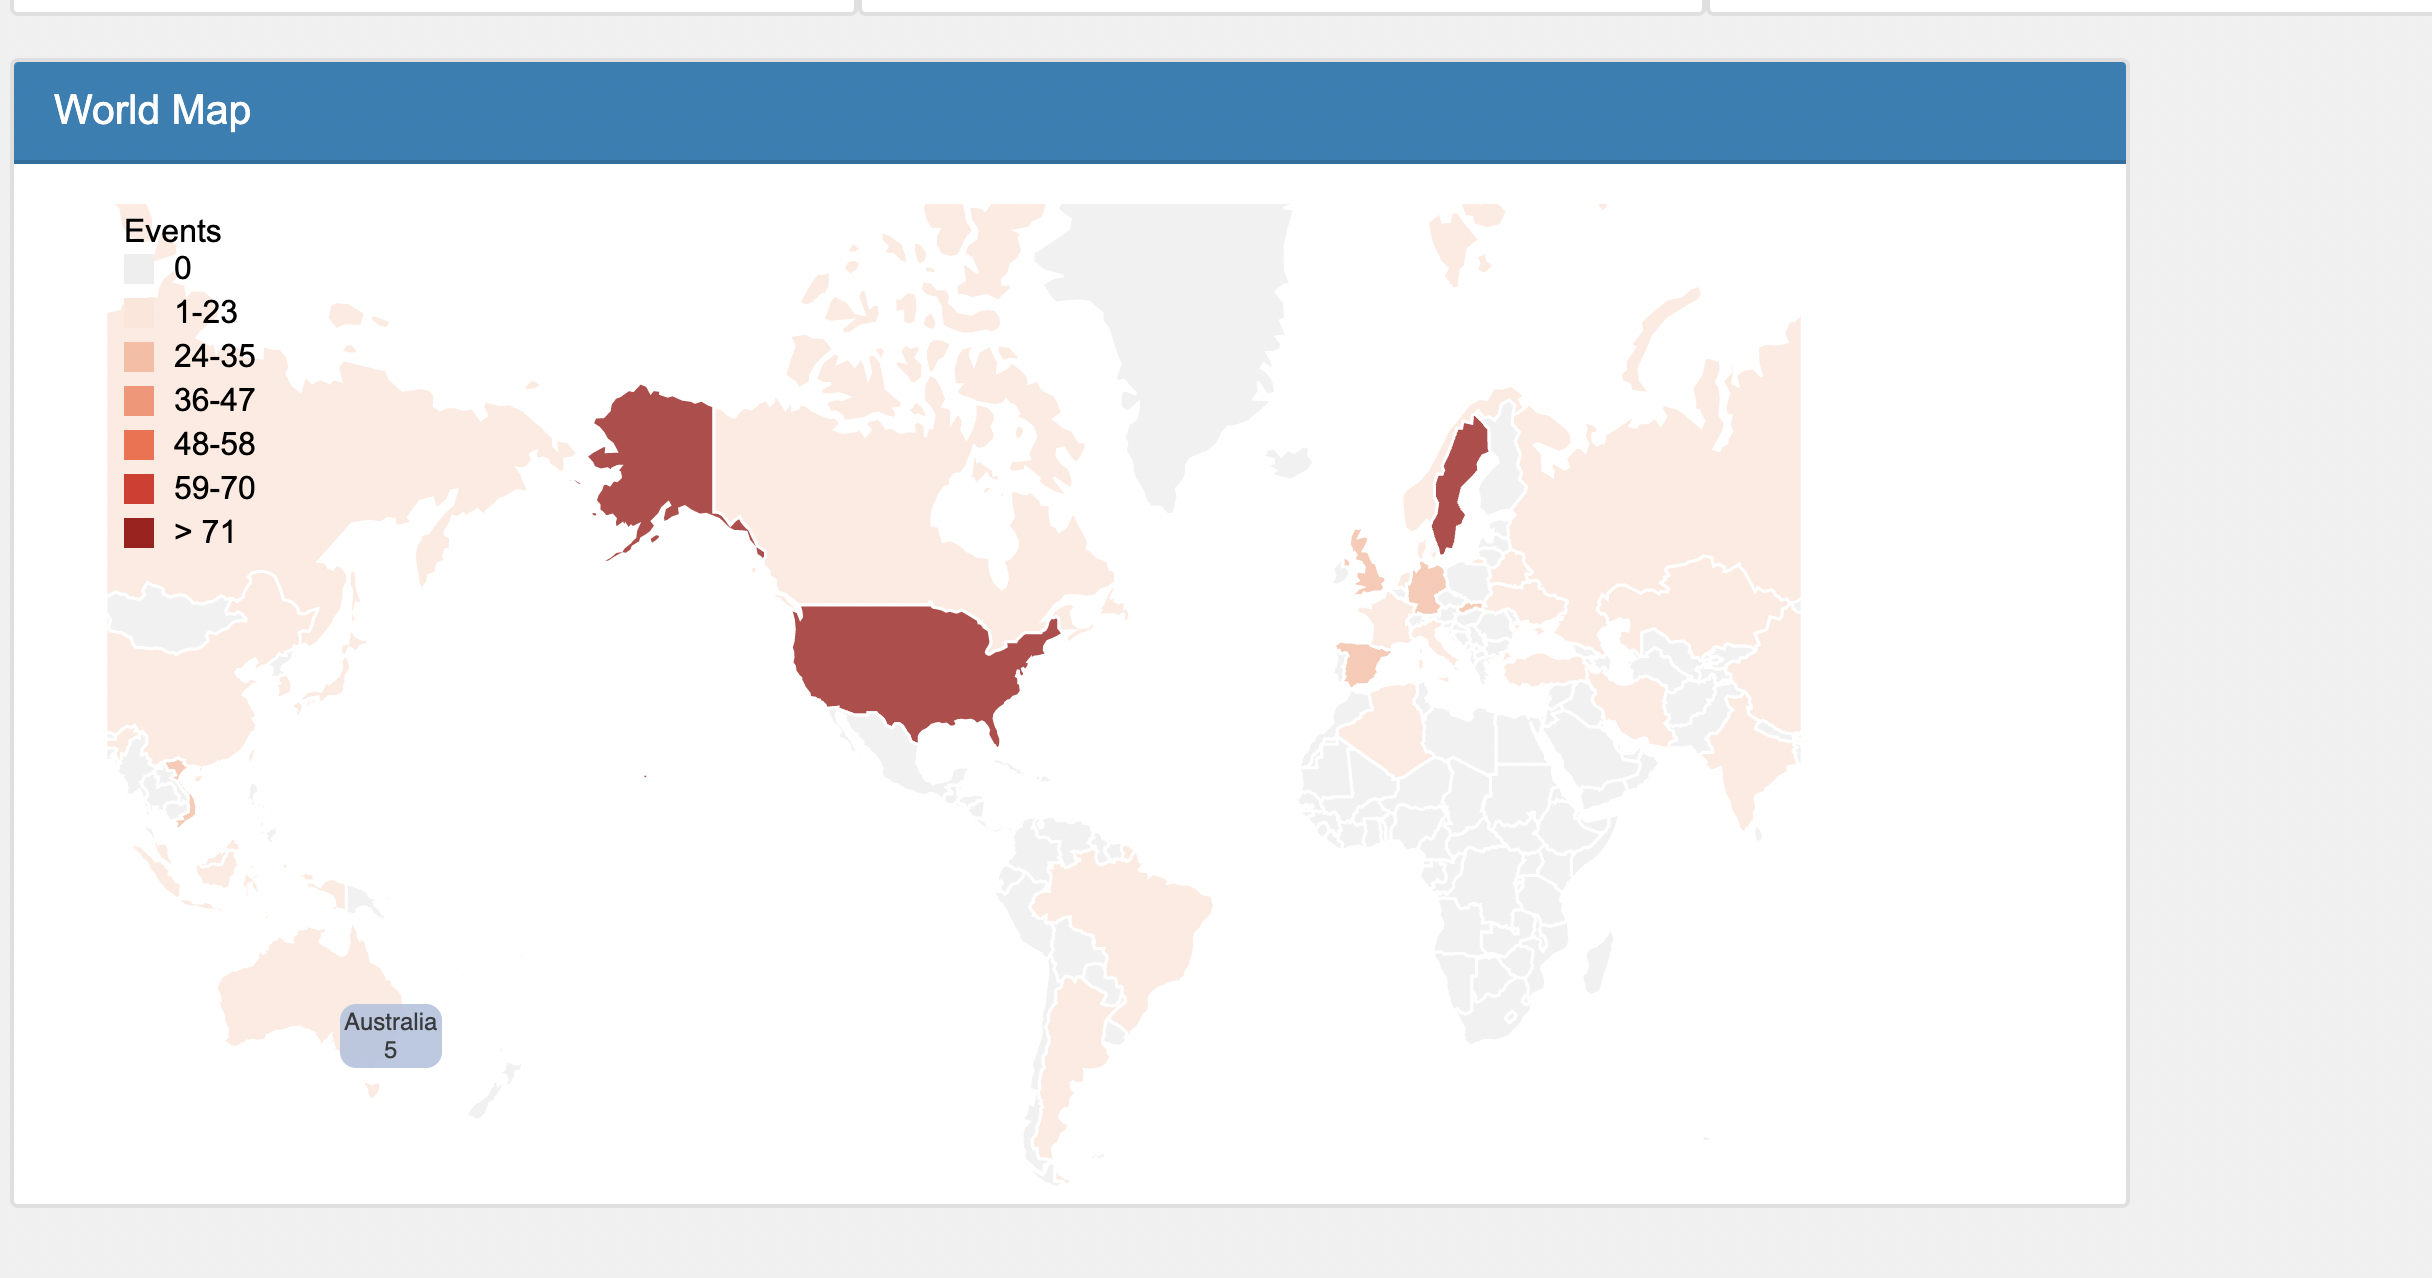
21.50.1. WAF Dashboard
The dashboard shows you web application firewall information by country and origin.
The dashoard is a convenient way of visualising the event data.
Note
Logfile Analysis needs to be enabled to see data in the Dashboard. It is disabled by default as it costs performance. It can be enabled at Settings.