21.24. Intrusion Detection
The diagnostics provide three tabs.
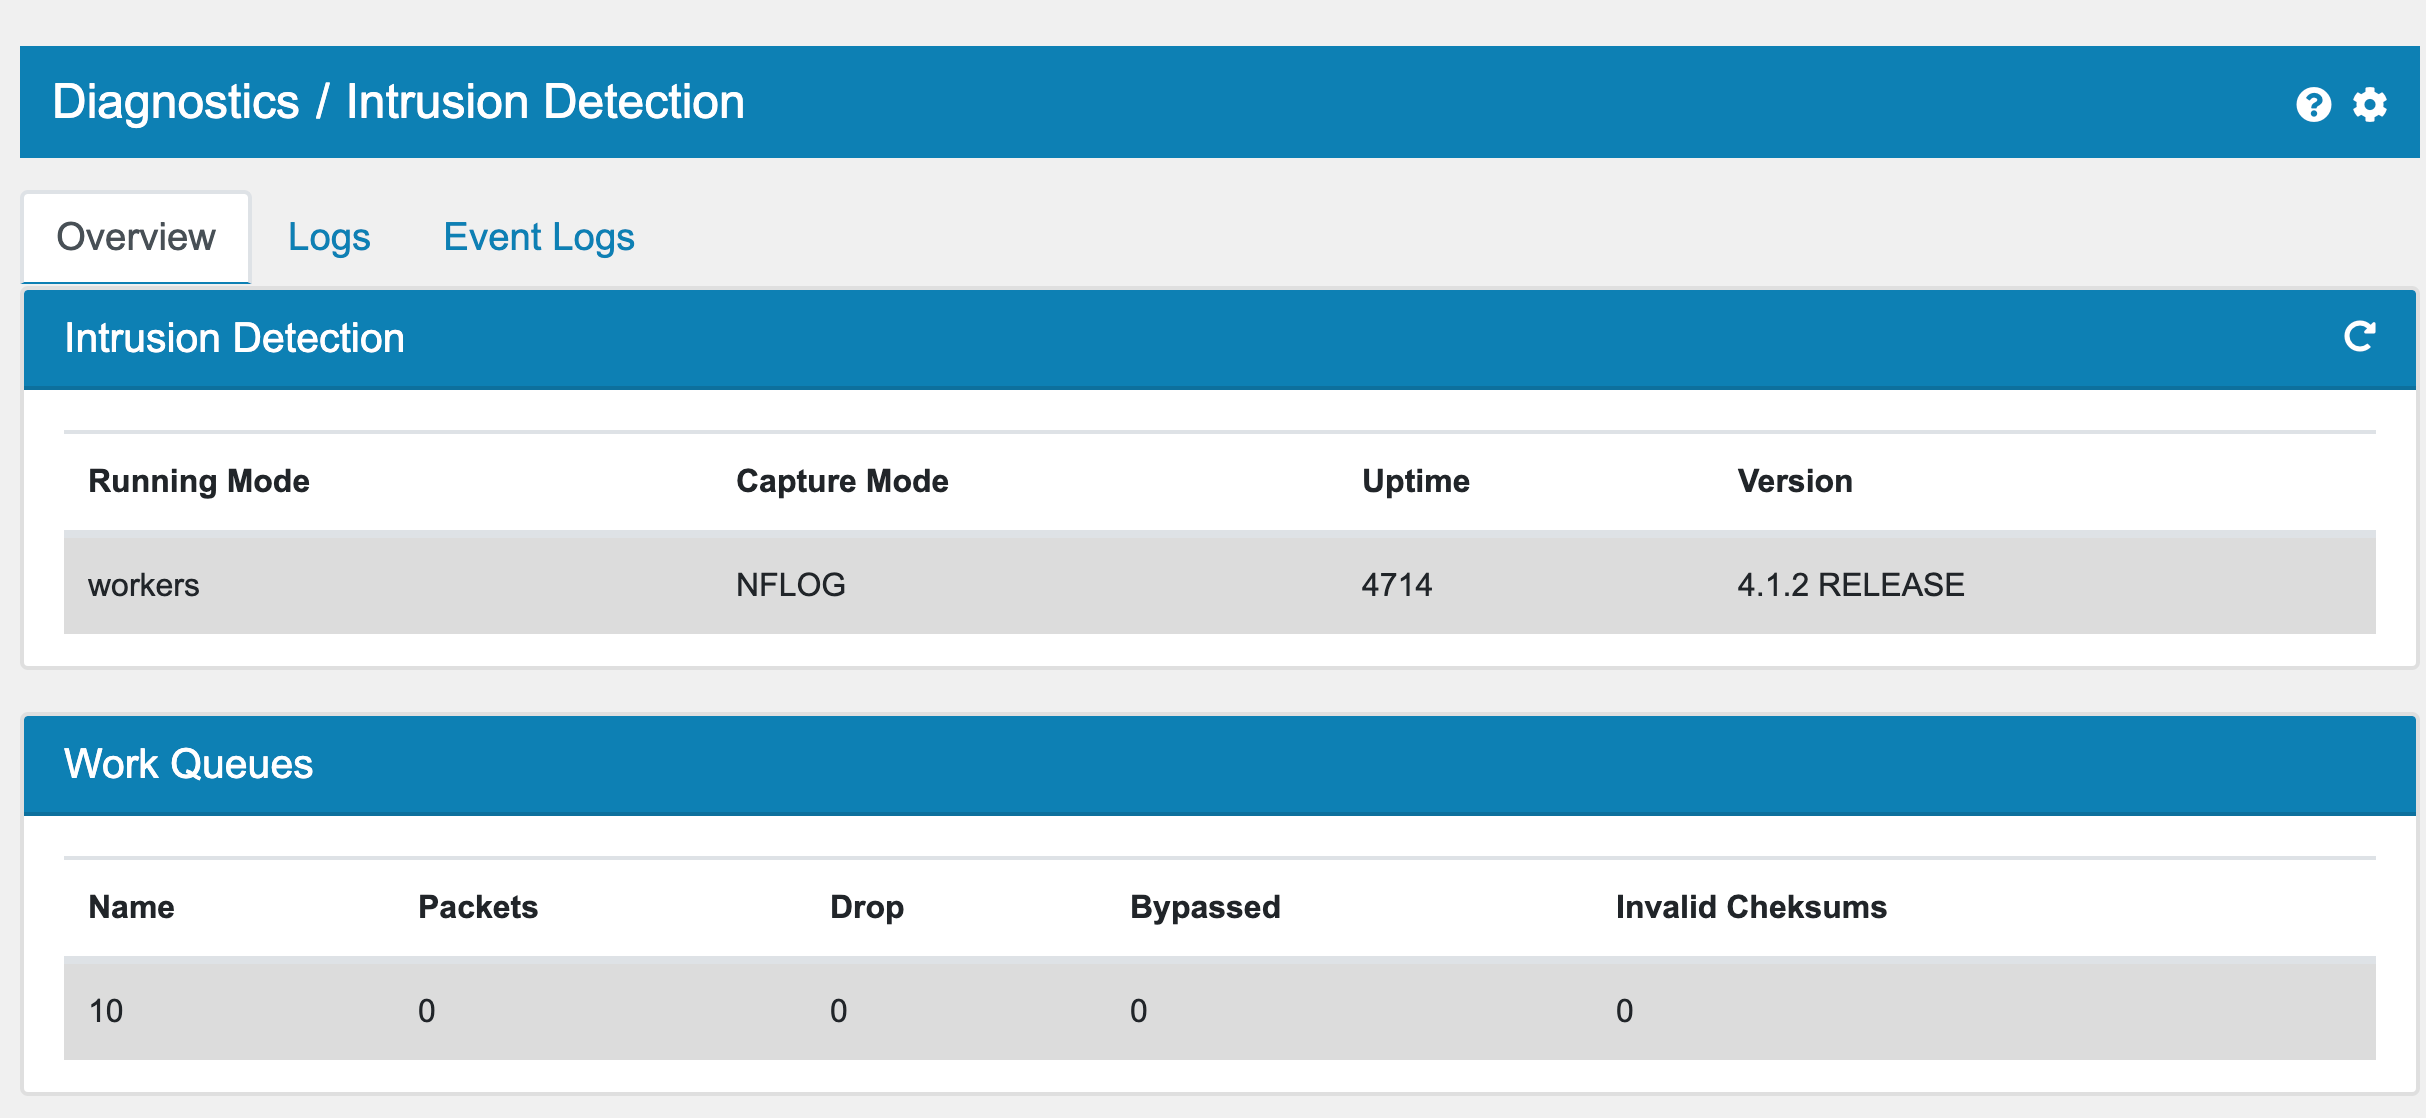
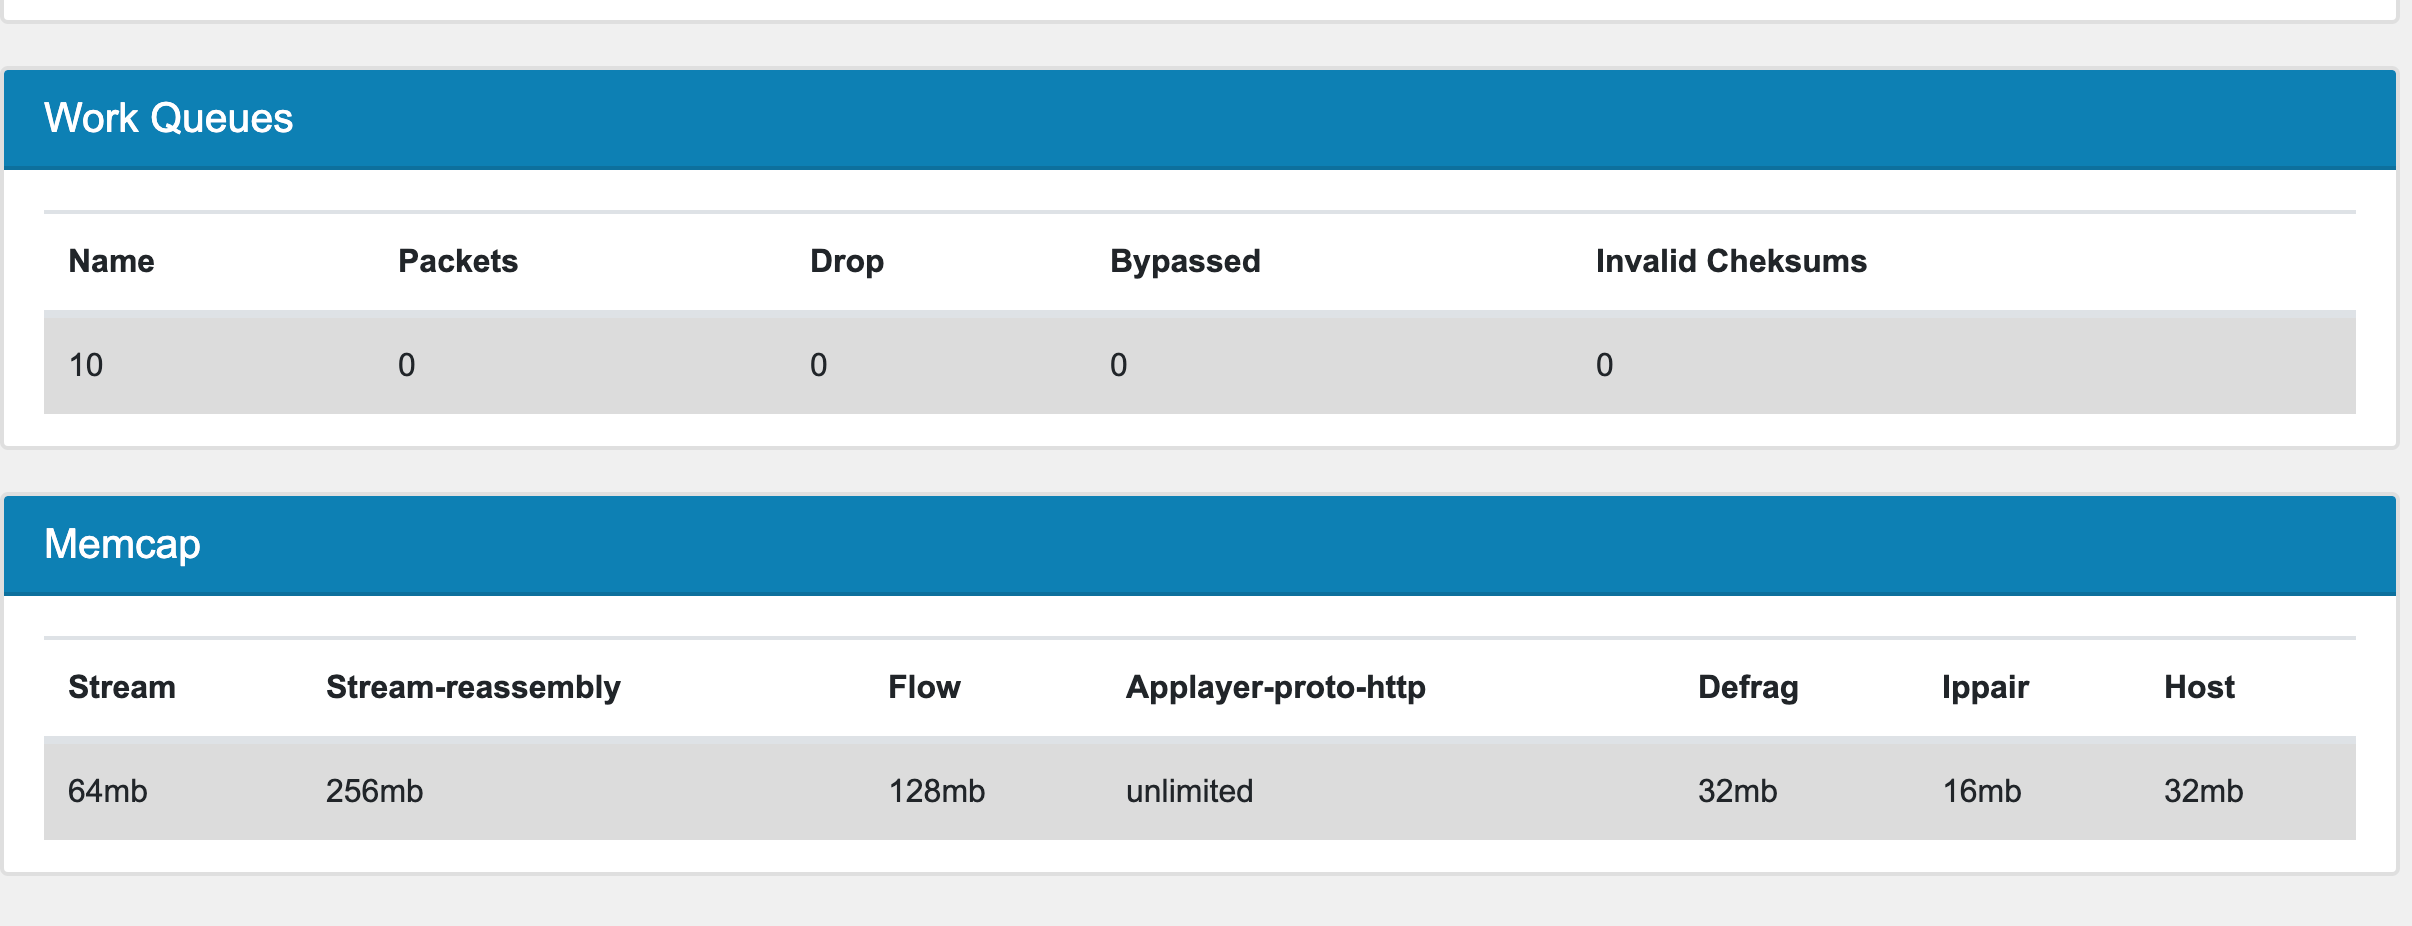
The Overview tab provides general information about memory usage and packet statistics.
The Dashboard tab provides an interactive view of the collected data from alerts and block events.
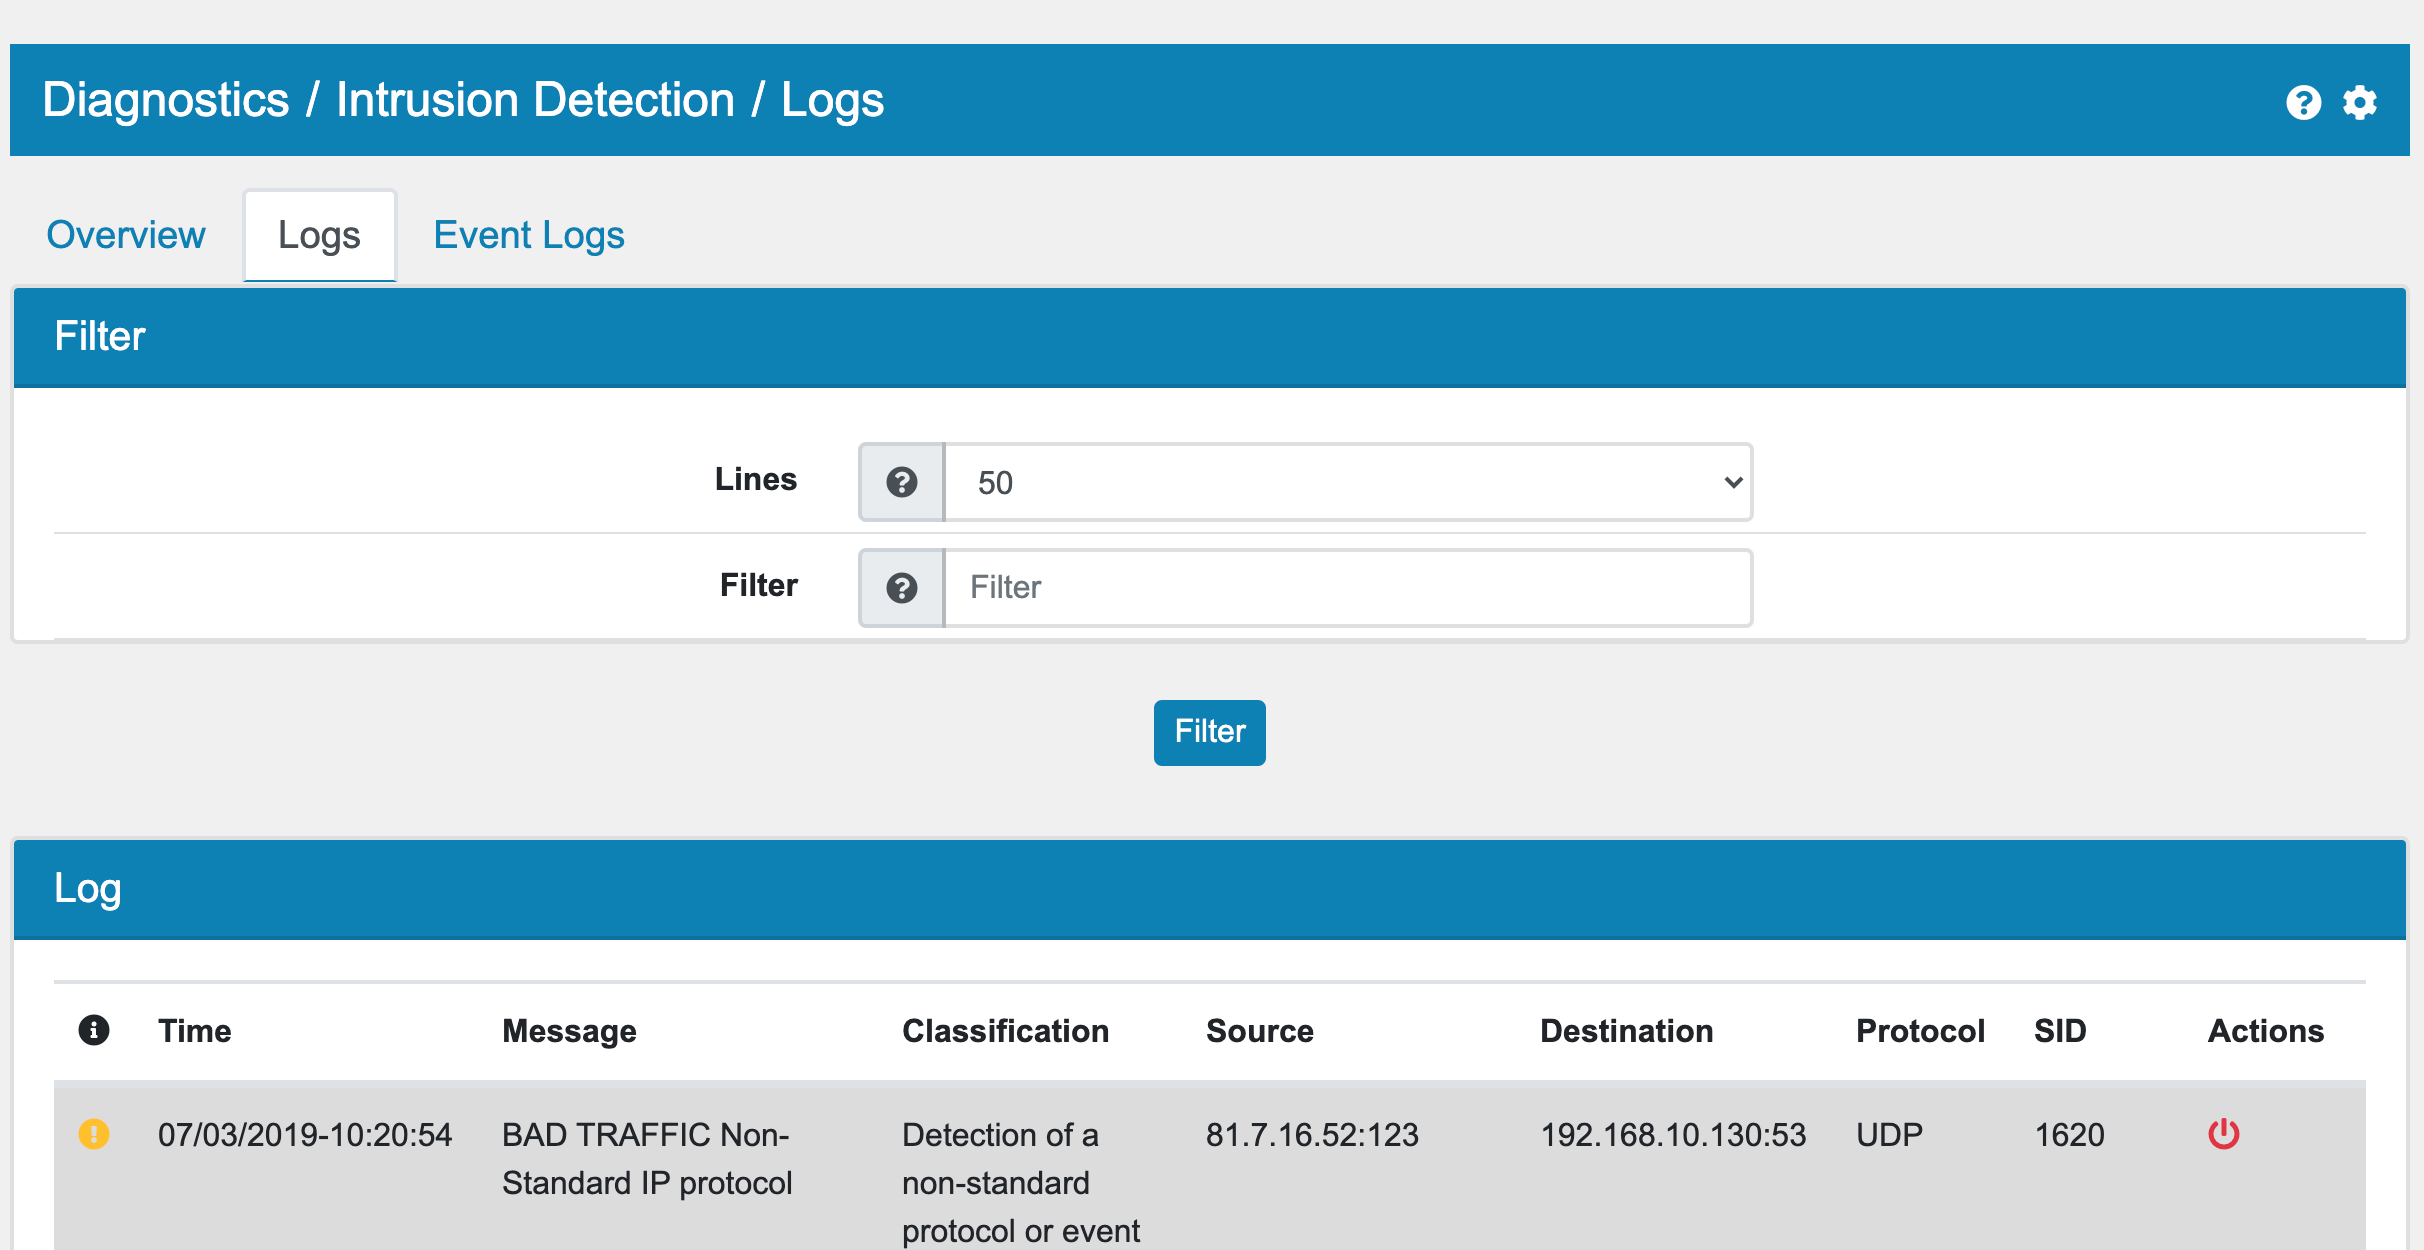
The Security Logs tab shows fast log matches for drop/reject events.
Note
The IDS engine might drop packets if they are too broken. In that case no rule id is present in the drop message.
The Audit Logs tab shows fast log matches for audit events.
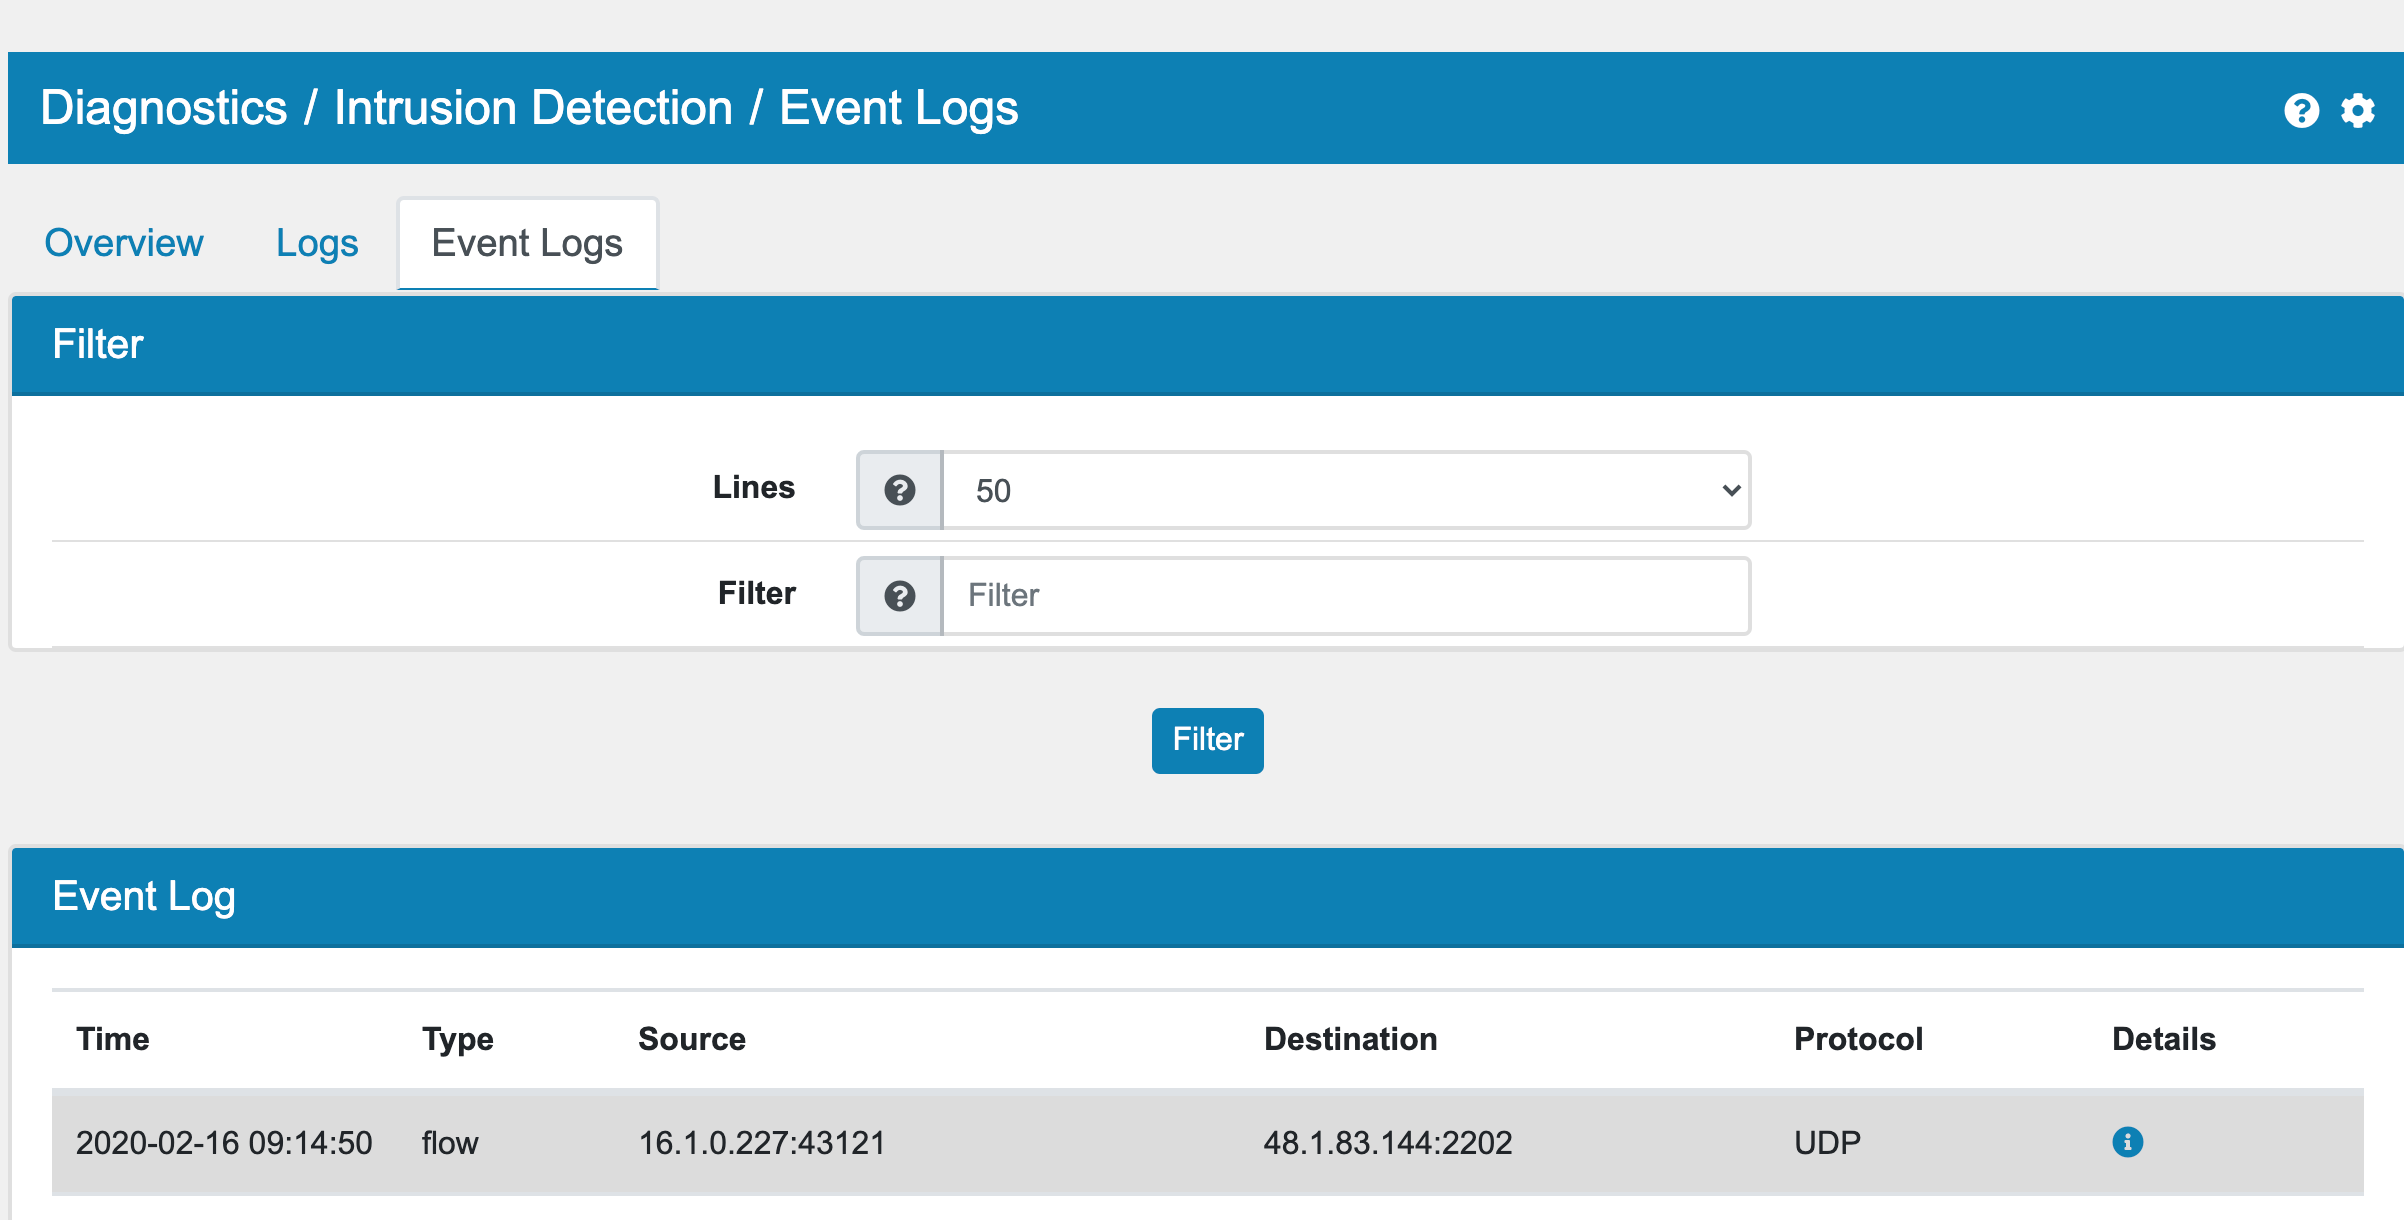
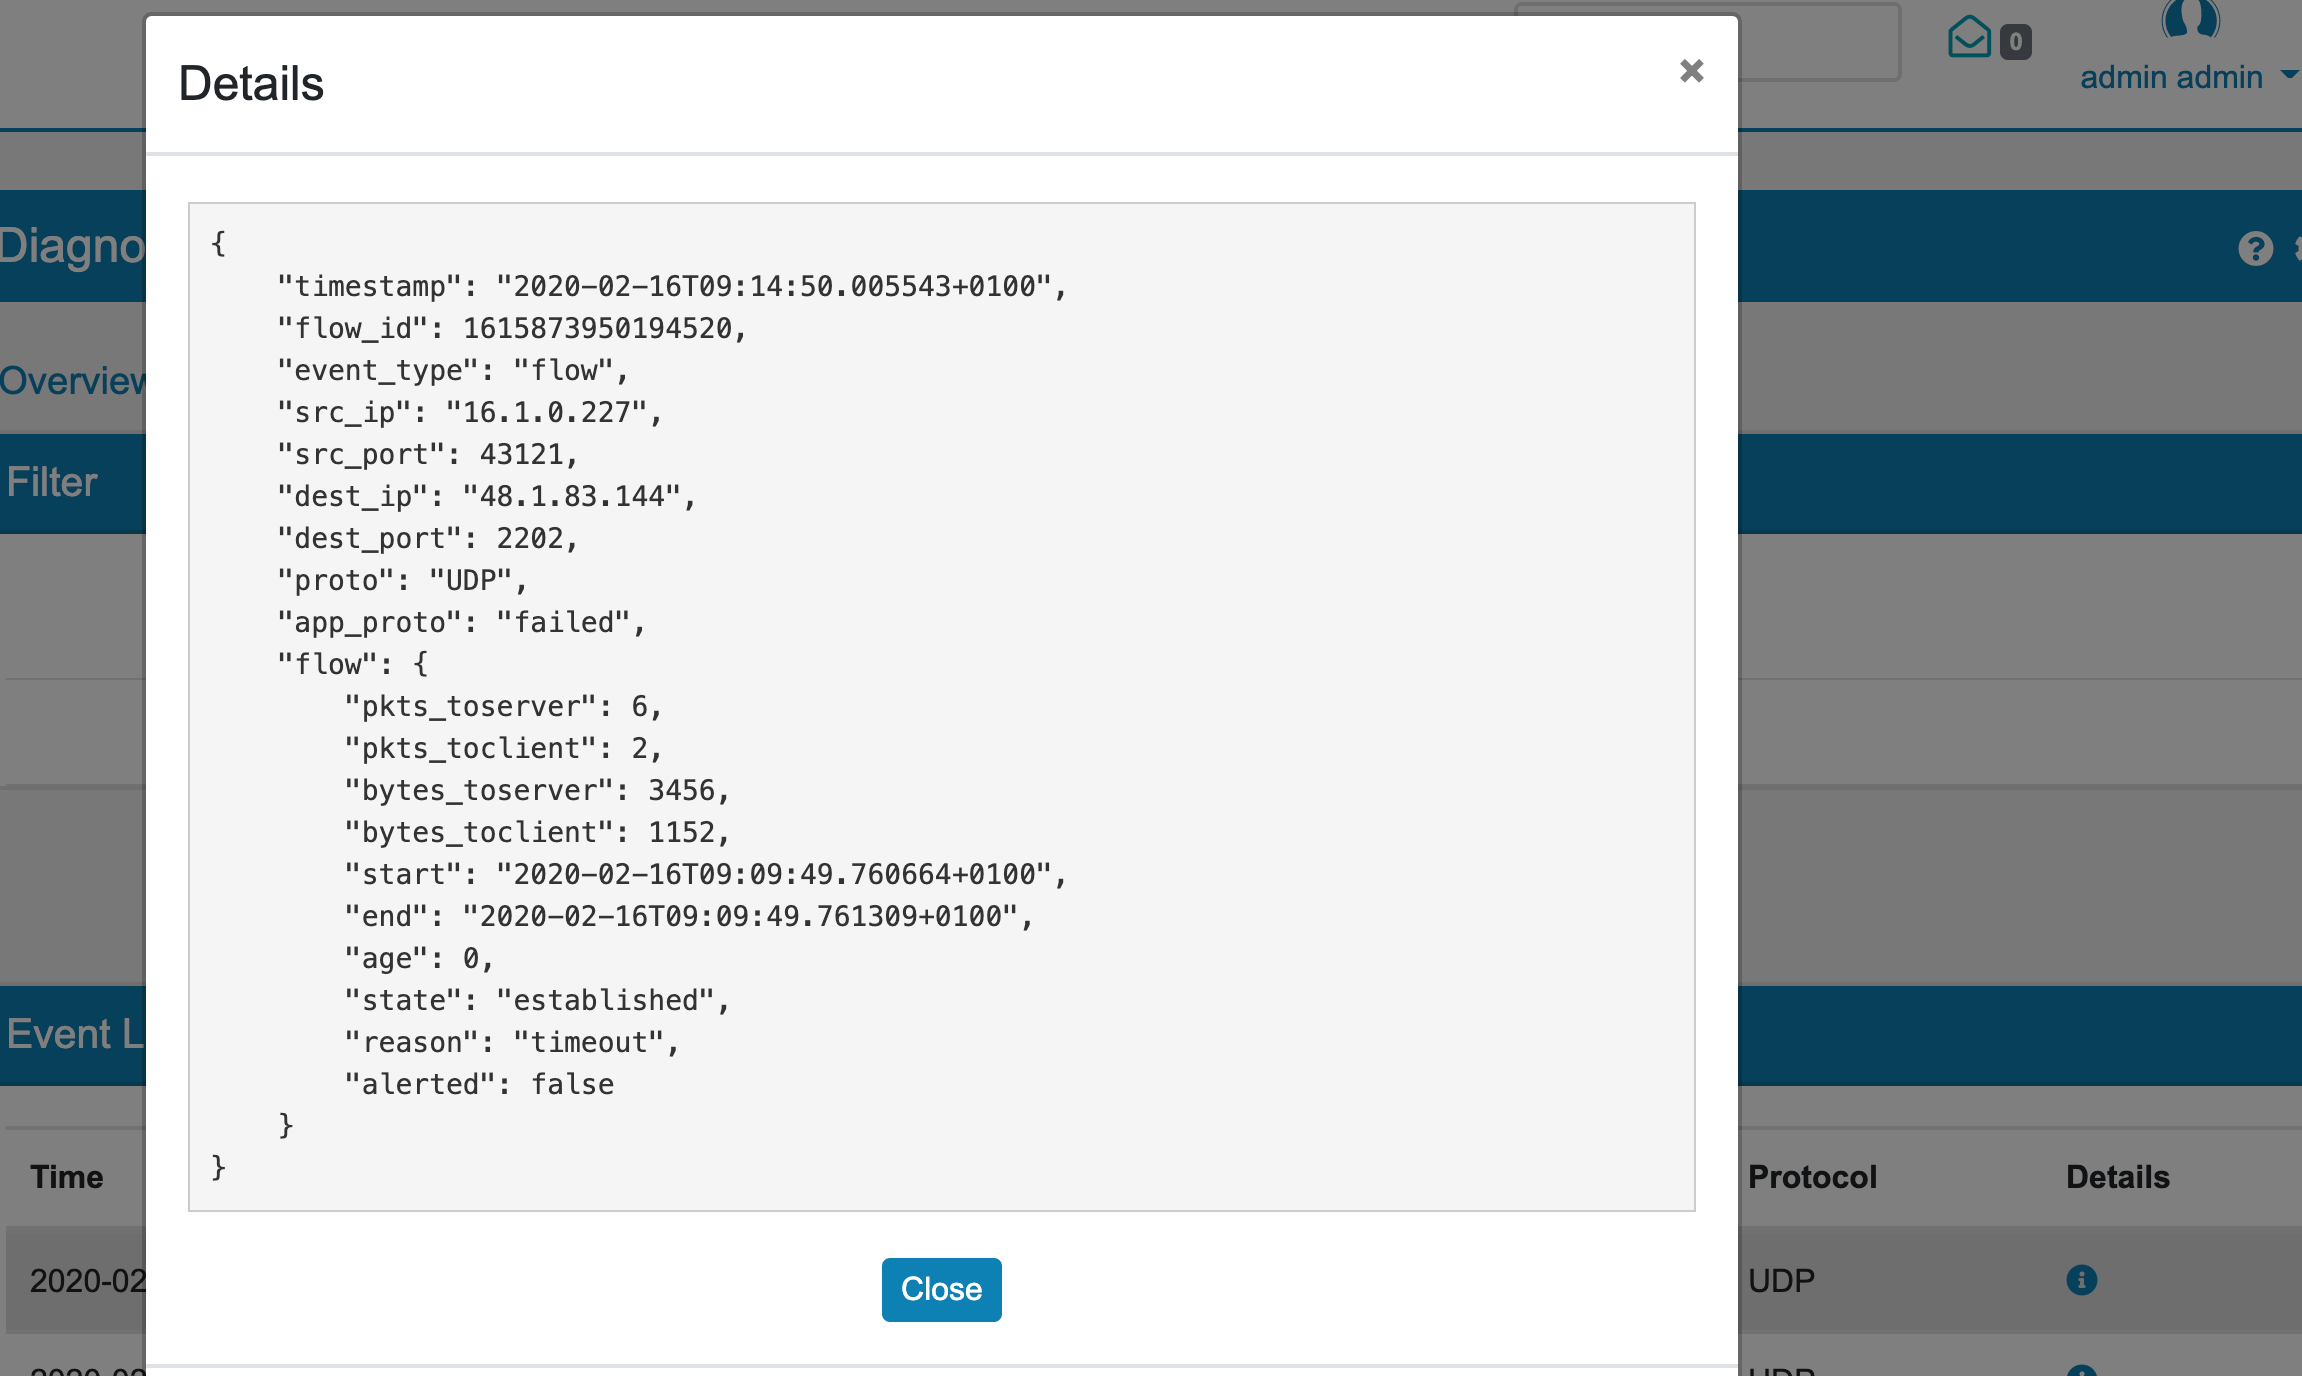
The Event Log shows detailed information for each matched flow with protocol and application data associated with a flow or event. Source and destination IPs can show reverse DNS entry on hover, as long as the VT AIR can resolve the IP.
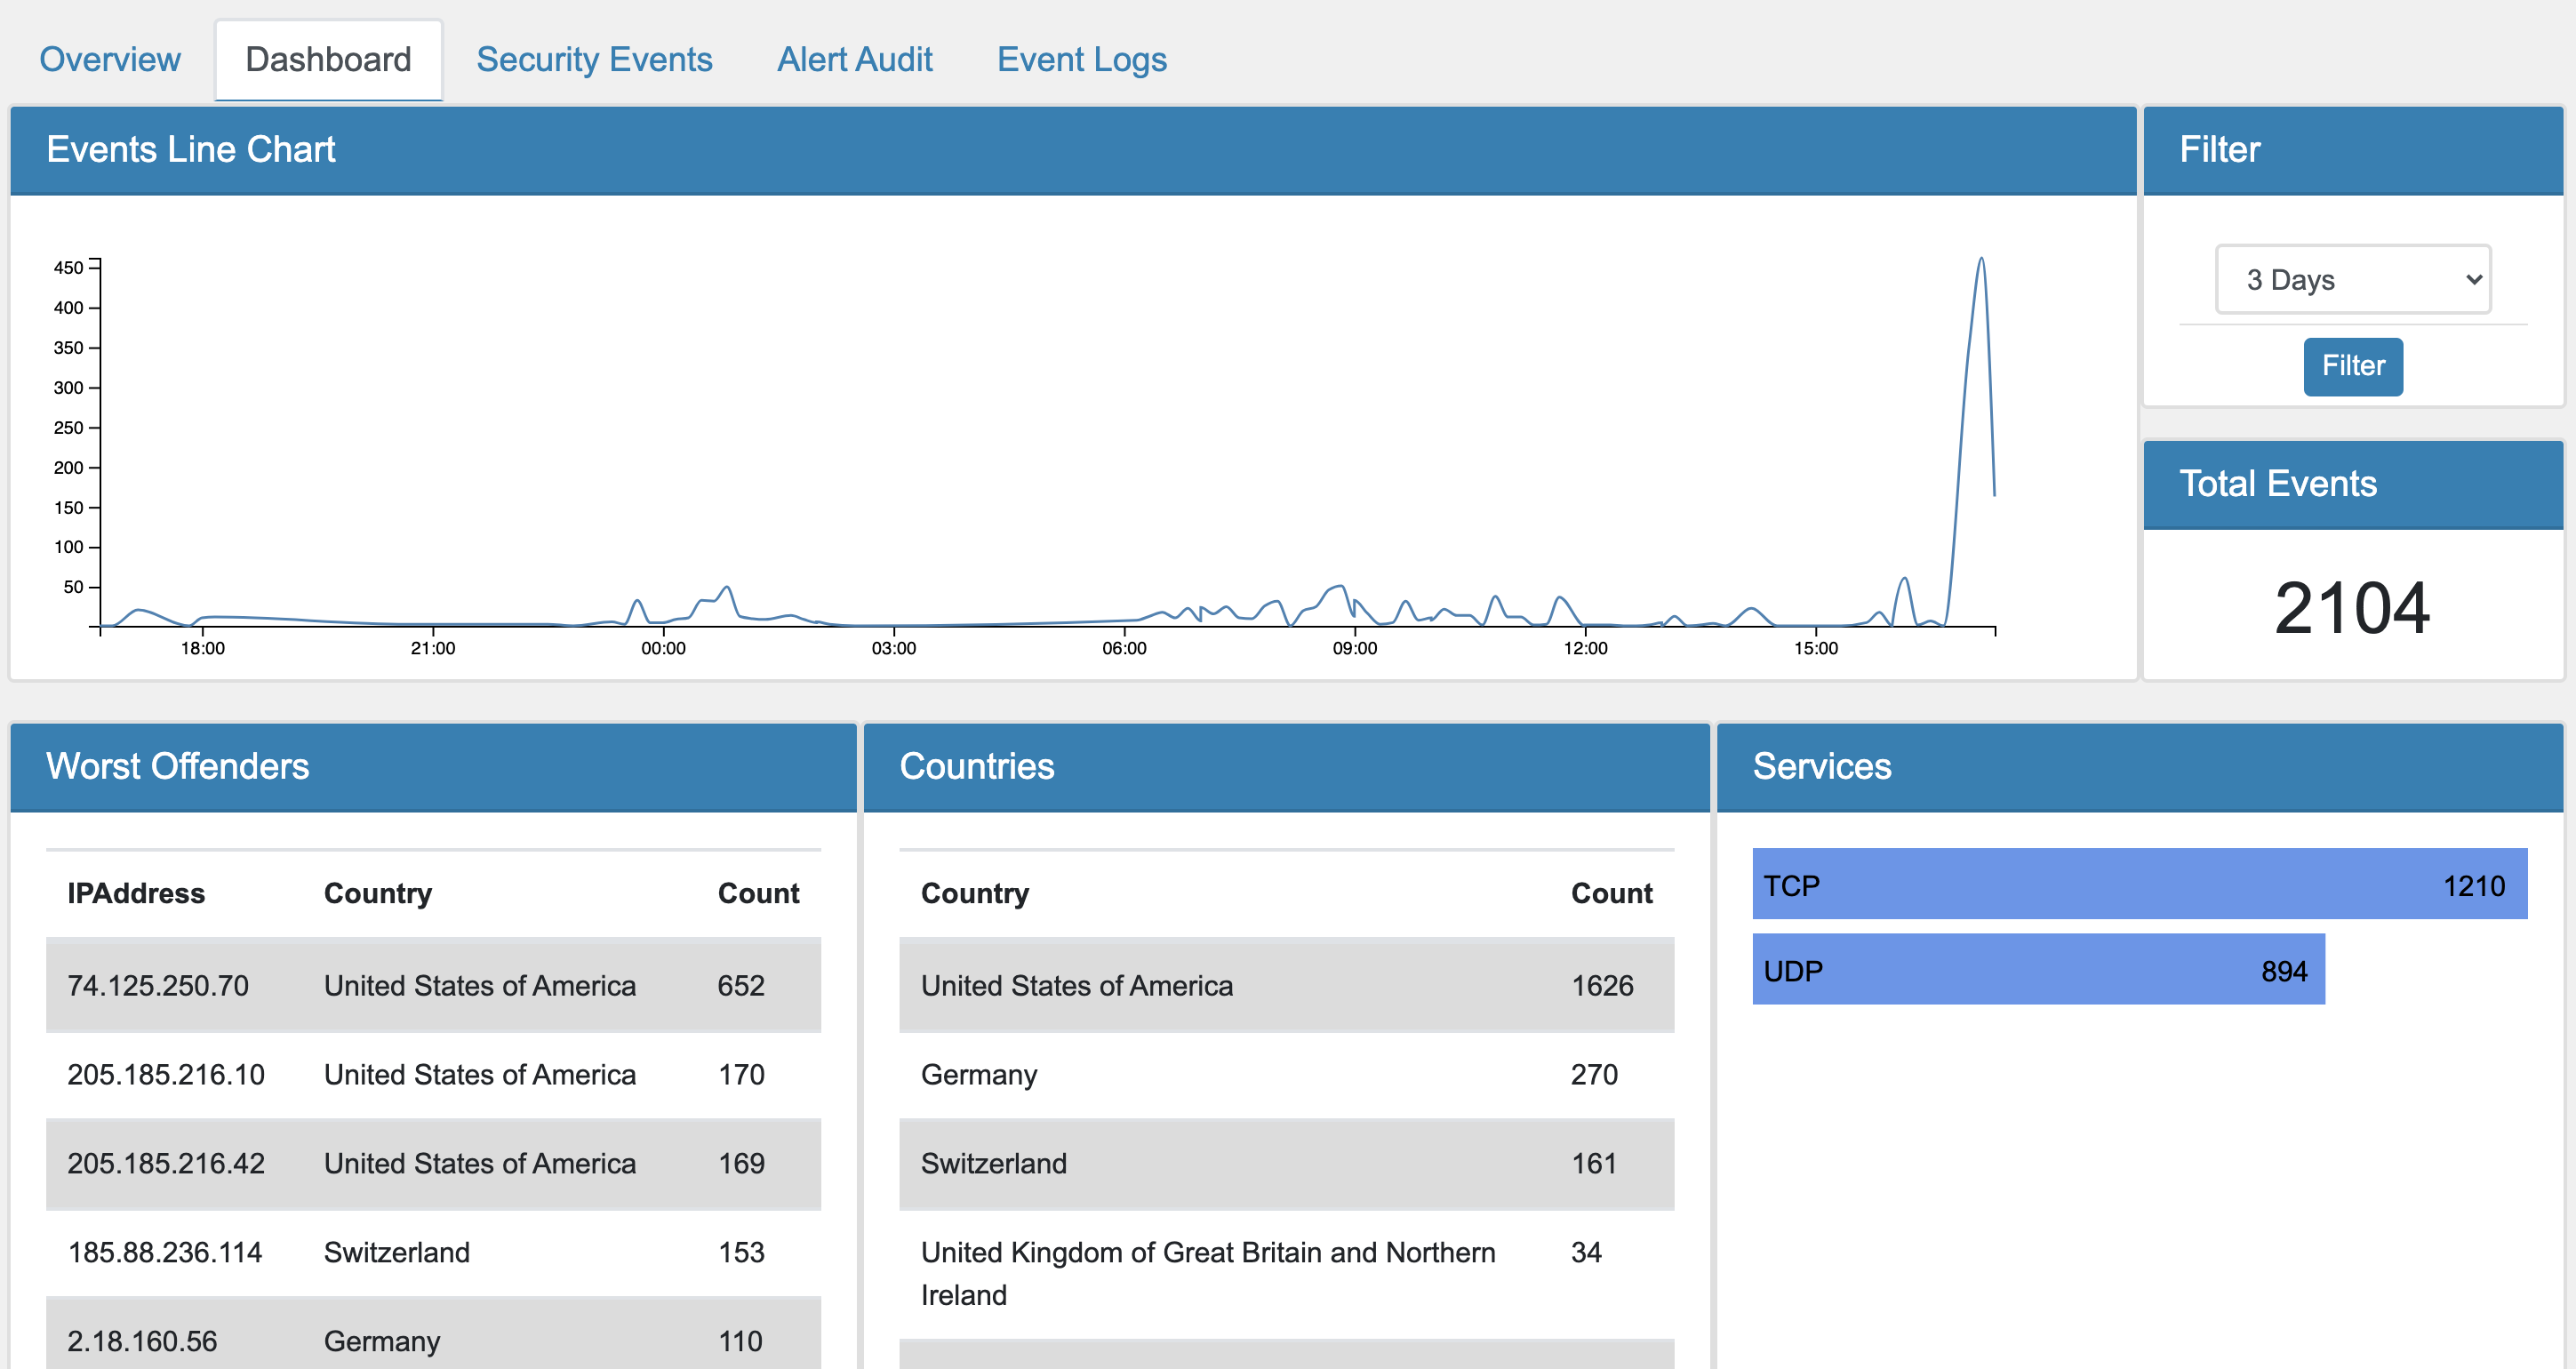
21.24.1. Intrusion Detection Dashboard
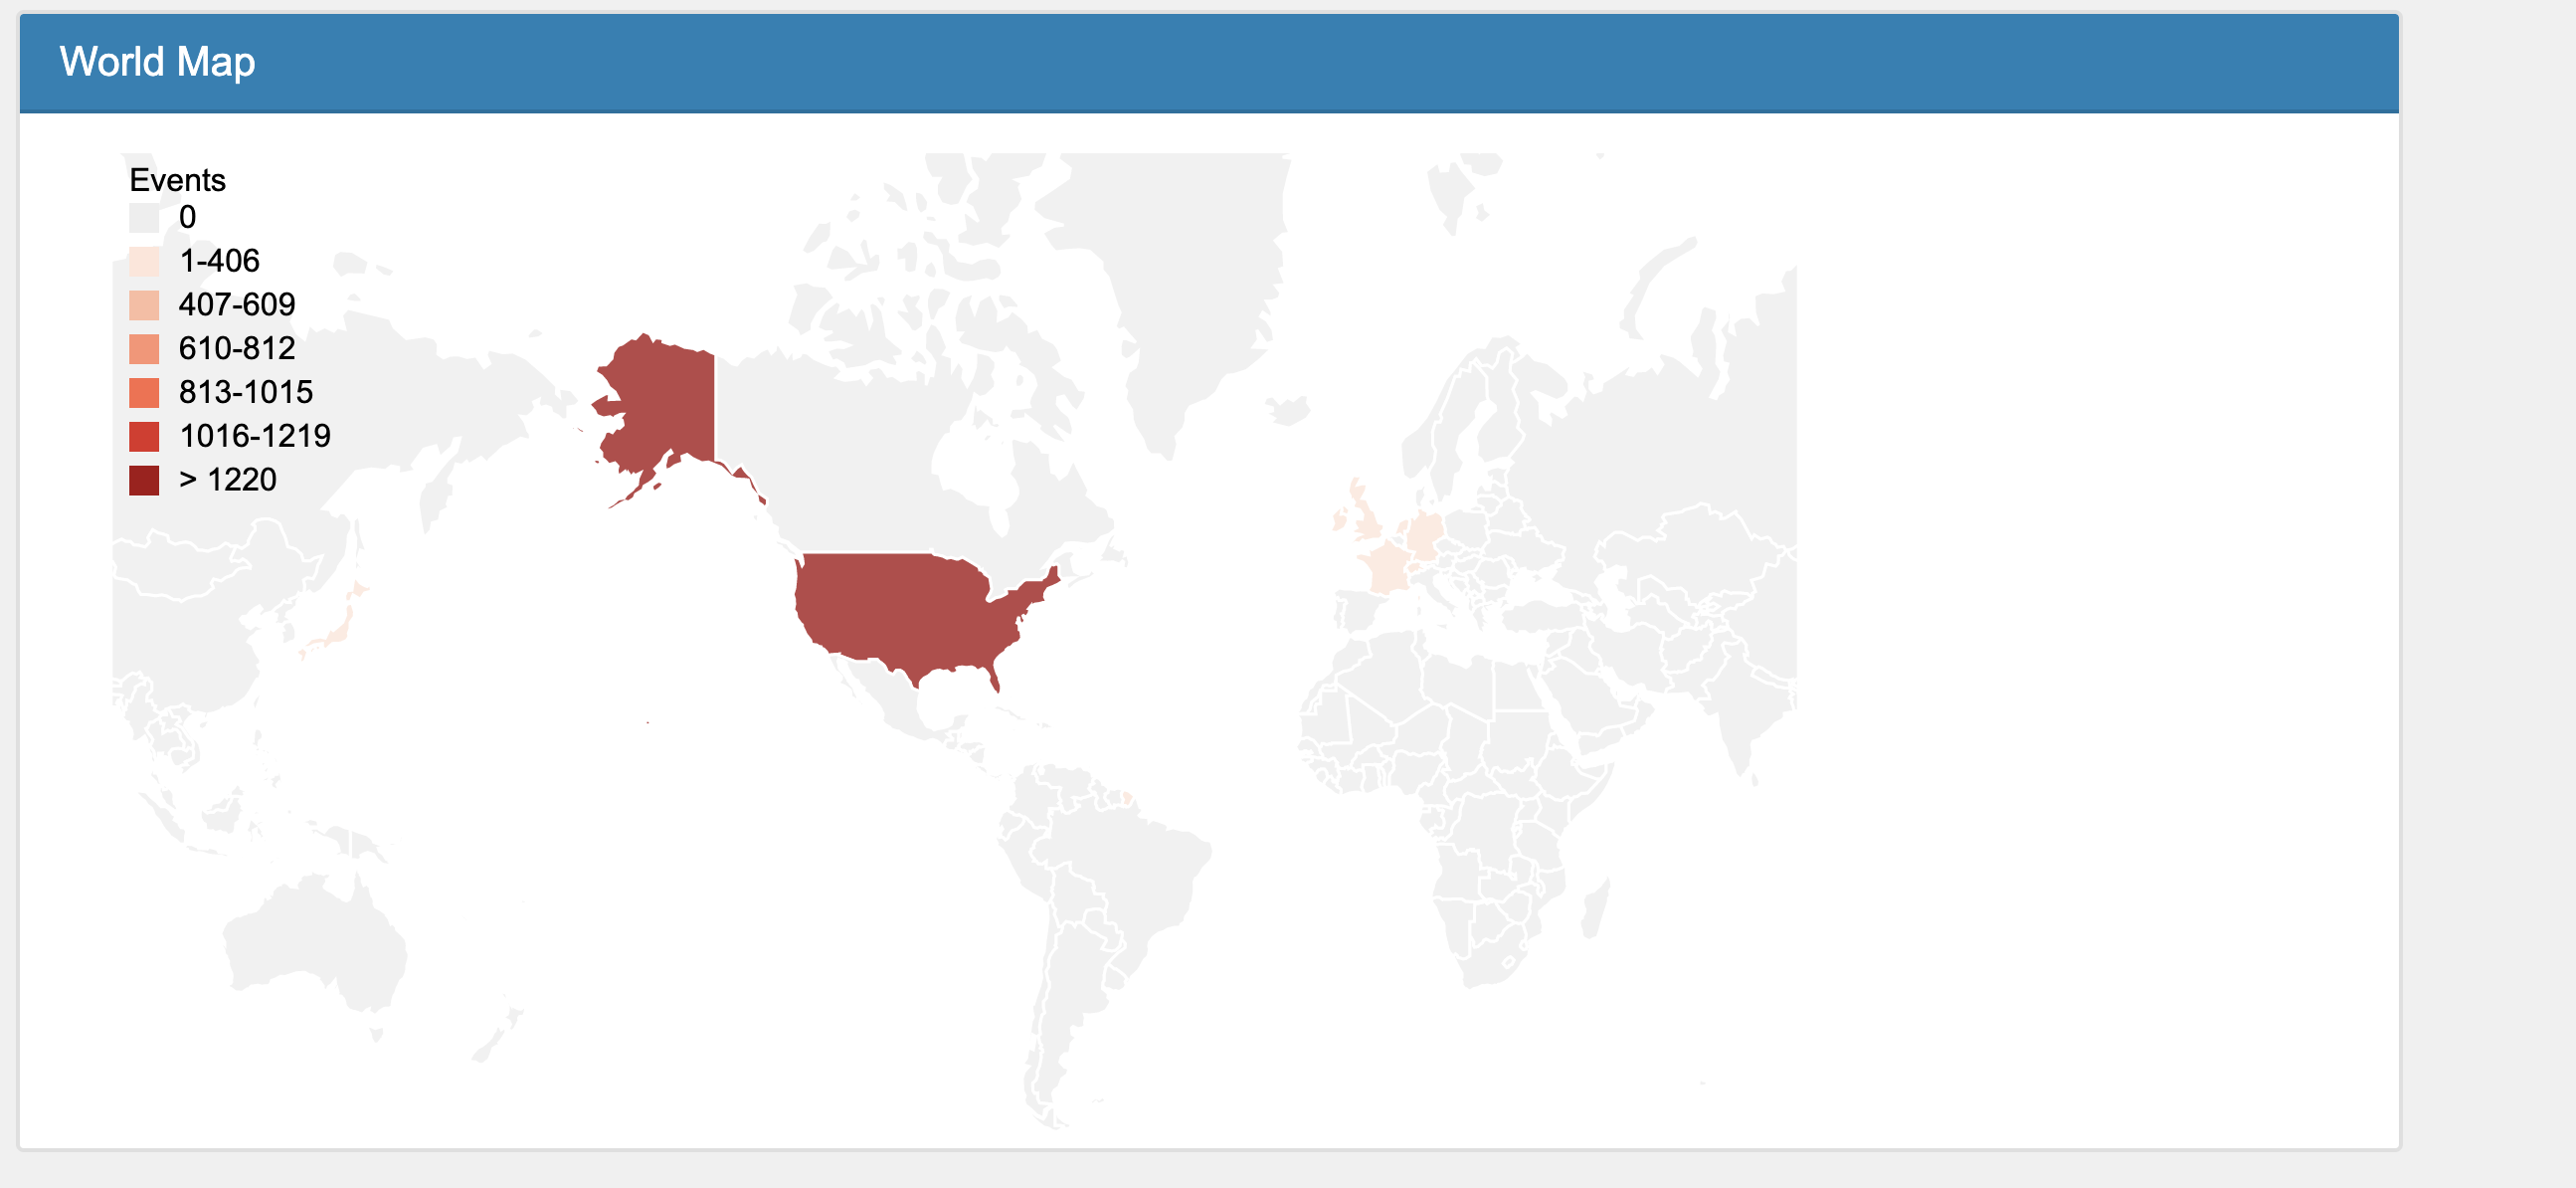
The dashboard shows you alert and block information by country and origin.
The dashoard is a convenient way of visualising the event data.
Note
Logfile Analysis needs to be enabled to see data in the Dashboard. It is disabled by default as it costs performance. It can be enabled at Settings.
Security and Alert Notifications can be downloaded at the bottom of the Dashboard. They are also included in the Report Email.