21.16. Firewall
You can find the Firewall Diagnostics at Diagnostics → Firewall → Firewall.
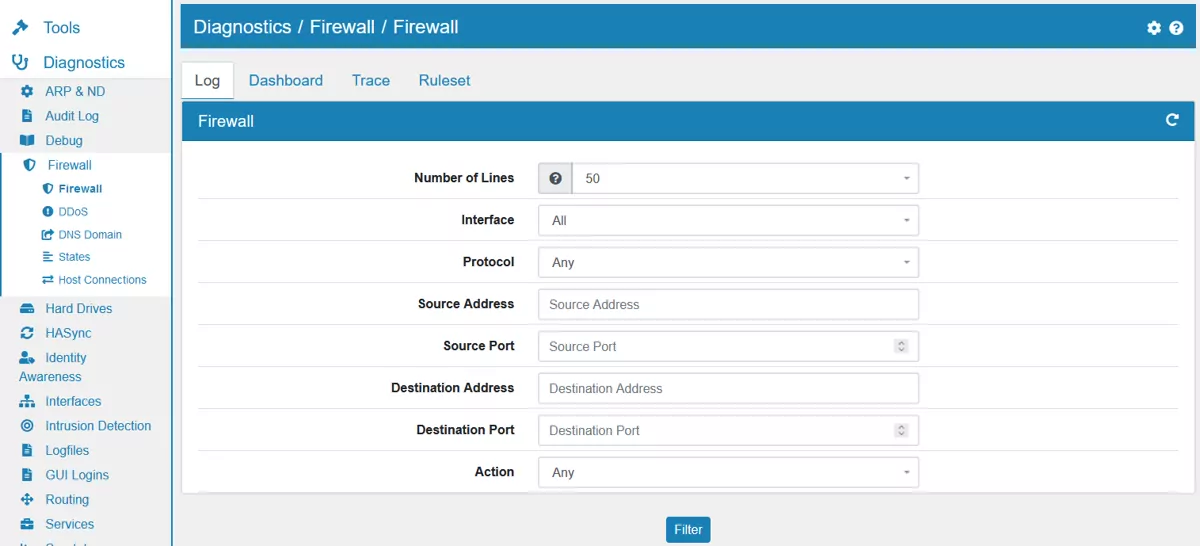
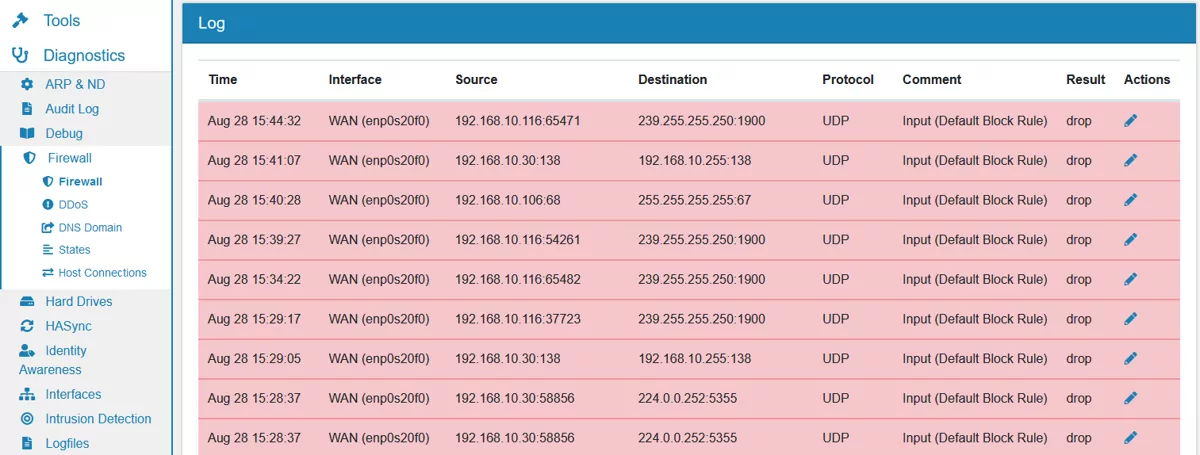
There are three tabs. In the Log tab you can browse, search and parse the current firewall log. Each log entry comes from the firewall log.
Be aware that by default only deny entries are logged. If you need more logging, turn it one in each firewall rule Firewall Rules (Forward and Input).
You can also create a firewall rule directly from a log entry by hitting the action symbol on the right.
Source and destination IPs can show reverse DNS entry on hover, as long as the VT AIR can resolve the IP.
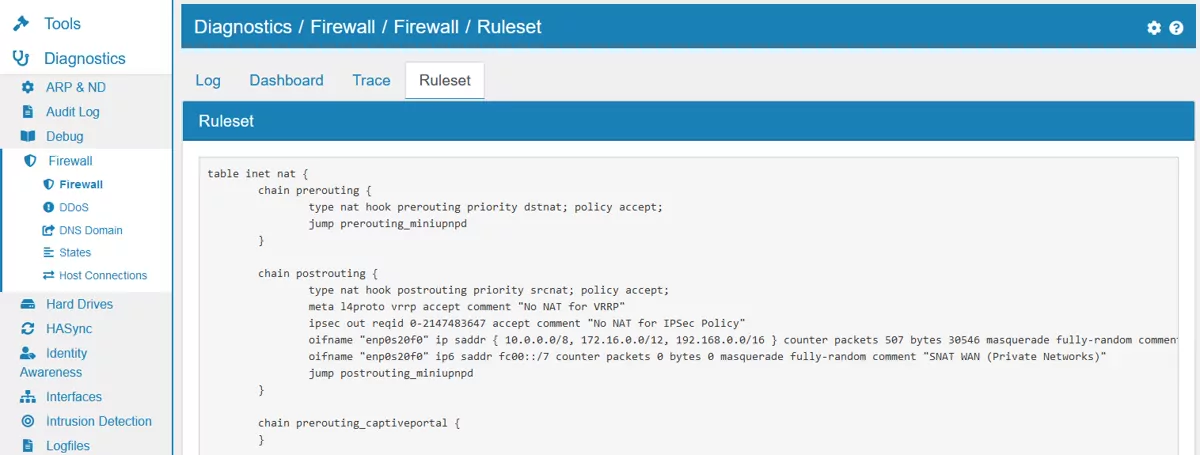
In the Ruleset tab you can see the current system firewall ruleset.
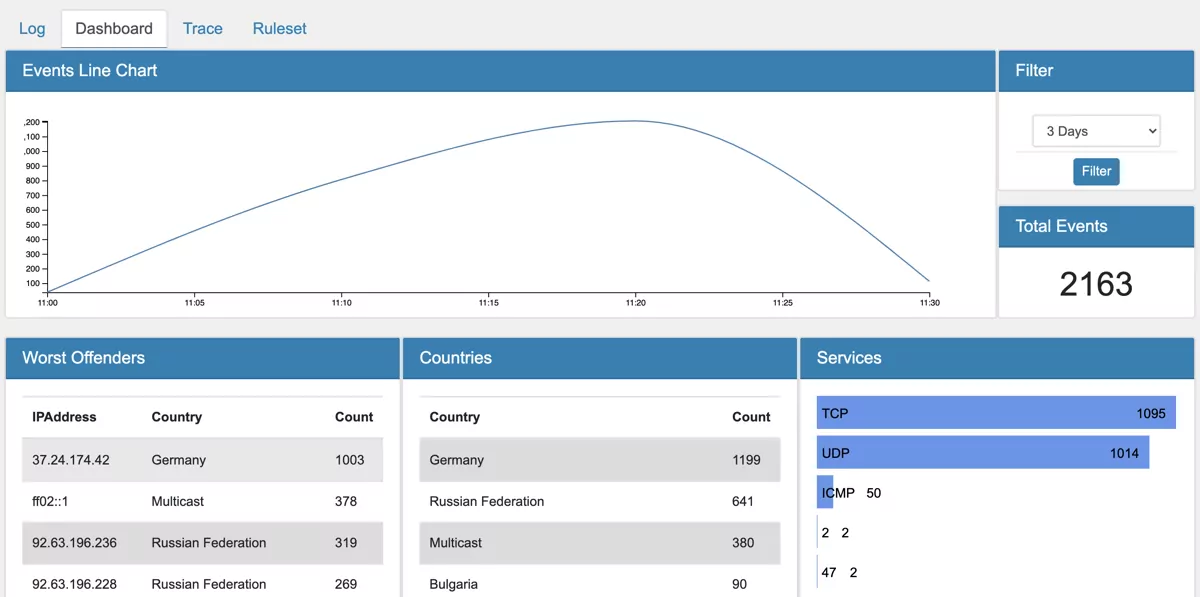
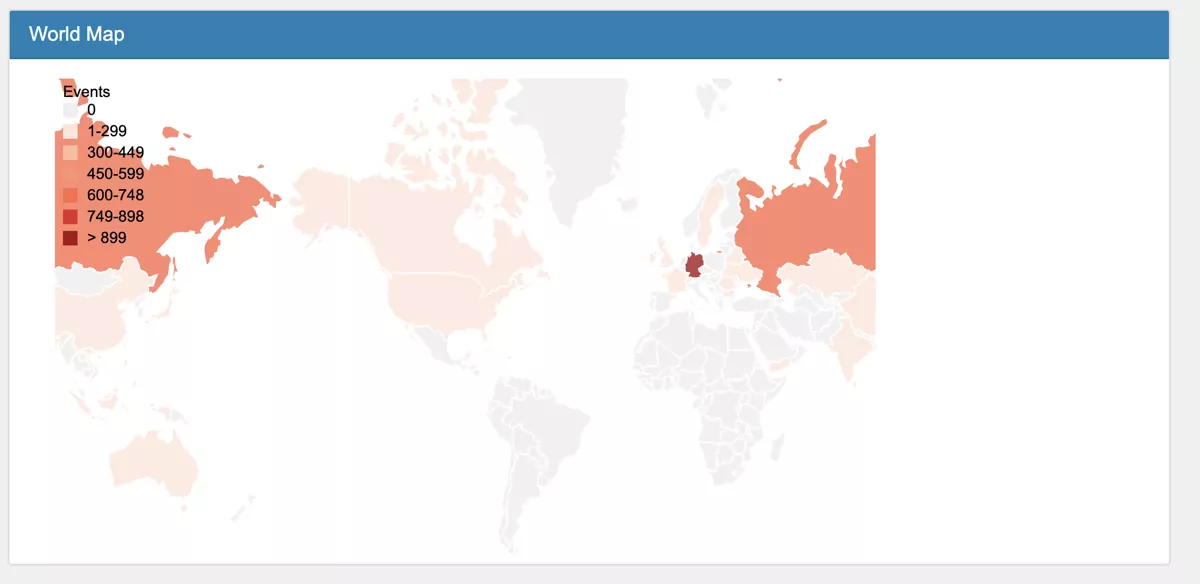
The Dashboard tab provides an interactive view of the collected data from log events.
21.16.1. Firewall Dashboard
The dashboard shows you firewall information by country and origin.
The dashoard is a convenient way of visualising the event data.
Note
Logfile Analysis needs to be enabled to see data in the Dashboard. It is disabled by default as it costs performance. It can be enabled at Settings.
21.16.3. Trace
If you enabled the trace option on one or more firewall rules, matching traffic can be seen here. This is a good tool to debug your firewall rules. The packet will be followed through the firewall from DNAT to rule until SNAT.
